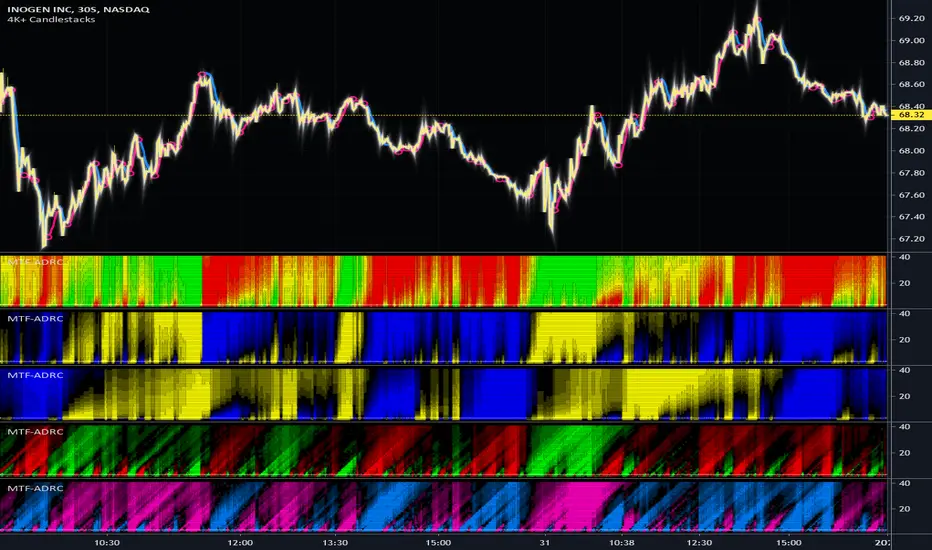
MTF Accumulation/Distribution RasterChart (Spectrogram/HeatMap)

Each of the algorithms use "volume" and "price" data in their calculations to provide a unique spectrogram for either algorithm chosen, hence the accumulation/distribution attributed to the title of this indicator. The MTF capabilities include seconds, minutes, and days. If the time frame settings are shorter in time than the current sampling interval, a warning will be appropriately displayed. Also, when volume data is not applicable to an asset, the indicator will become completely red. I included so many color scheming techniques I couldn't demonstrate all of them above. This indicator has what I would term as "predator" vision. For those of you who have seen these movies, you will understand what I have built.
The use of this indicator is just like any of my other RasterCharts or heatmap indicators found on the internet, except it has much more versatility. This indicator has so many uses, I really haven't discovered all of it's characteristics yet. Anyhow, this is one of my most beautiful indicators I have created so far, but I feel there is still more room for enhancements with a possibility of more sibling algorithms to incorporate later. Lastly, I couldn't have done this without the computing power/wizardry provided by ALL Tradingview staff. They deserve a HUGE and proper, THANK YOU!!! Happy New Year 2020 everyone...
Features List Includes:
MTF controls for seconds, minutes, and days
Multiple volume weighted algorithms to choose from
Gain control for algorithm #1
Adjustable horizontal rule to differentiate between more reactive aspects of turning point fluctuations in the lower portion of the chart (visible above)
Adjustable heatmap brightness control
Visual color scheme techniques (a few of many are displayed above)
Color inversion control
"NO VOLUME" detection (indicator becomes red)
This is not a freely available indicator, FYI. To witness my Pine poetry in action, properly negotiated requests for unlimited access, per indicator, may ONLY be obtained by direct contact with me using TV's "Private Chats" or by "Message" hidden in my member name above. The comments section below is solely just for commenting and other remarks, ideas, compliments, etc... regarding only this indicator, not others. When available time provides itself, I will consider your inquiries, thoughts, and concepts presented below in the comments section, should you have any questions or comments regarding this indicator. When my indicators achieve more prevalent use by TV members, I may implement more ideas when they present themselves as worthy additions. As always, "Like" it if you simply just like it with a proper thumbs up, and also return to my scripts list occasionally for additional postings. Have a profitable future everyone!
Invite-only script
Only users approved by the author can access this script. You'll need to request and get permission to use it. This is typically granted after payment. For more details, follow the author's instructions below or contact ImmortalFreedom directly.
TradingView does NOT recommend paying for or using a script unless you fully trust its author and understand how it works. You may also find free, open-source alternatives in our community scripts.
Author's instructions
Disclaimer
Invite-only script
Only users approved by the author can access this script. You'll need to request and get permission to use it. This is typically granted after payment. For more details, follow the author's instructions below or contact ImmortalFreedom directly.
TradingView does NOT recommend paying for or using a script unless you fully trust its author and understand how it works. You may also find free, open-source alternatives in our community scripts.