OPEN-SOURCE SCRIPT
Custom Moving Average Cross - White
//version=5
indicator("Custom Moving Average Cross", overlay=true)
// User-defined parameters for moving averages
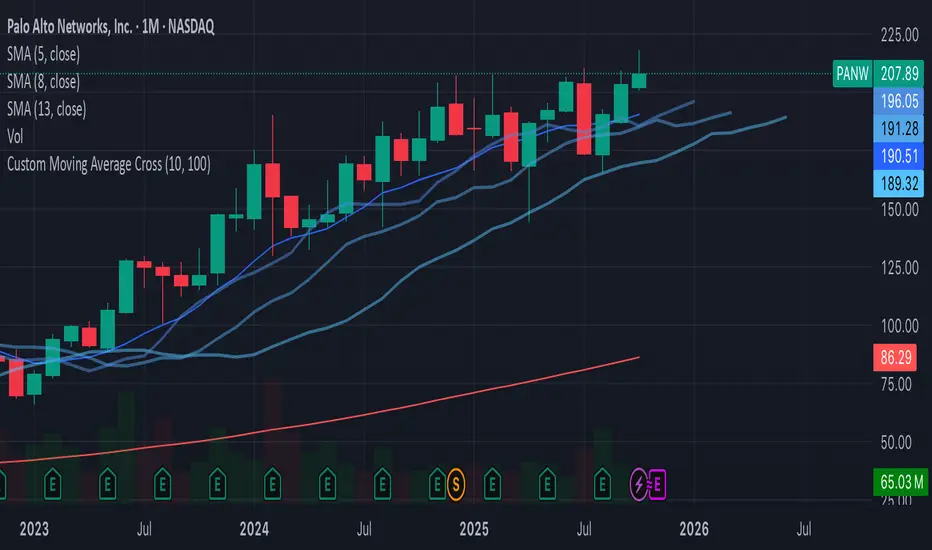
short_period = input.int(10, title="Short Period", minval=1)
long_period = input.int(100, title="Long Period", minval=1)
// Calculate the moving averages
short_ma = ta.sma(close, short_period)
long_ma = ta.sma(close, long_period)
// Plot the moving averages
plot(short_ma, color=color.blue, title="Short MA")
plot(long_ma, color=color.red, title="Long MA")
// Define the buy and sell conditions based on crossovers
buy_signal = ta.crossover(short_ma, long_ma)
sell_signal = ta.crossunder(short_ma, long_ma)
// Plot the buy and sell signals with labels (white text)
plotshape(buy_signal, location=location.belowbar, color=color.green, style=shape.labelup, title="Buy Signal", text="BUY", textcolor=color.white)
plotshape(sell_signal, location=location.abovebar, color=color.red, style=shape.labeldown, title="Sell Signal", text="SELL", textcolor=color.white)
// Optional: Background color to highlight the signals
bgcolor(buy_signal ? color.new(color.green, 90) : na, title="Buy Signal Background")
bgcolor(sell_signal ? color.new(color.red, 90) : na, title="Sell Signal Background")
indicator("Custom Moving Average Cross", overlay=true)
// User-defined parameters for moving averages
short_period = input.int(10, title="Short Period", minval=1)
long_period = input.int(100, title="Long Period", minval=1)
// Calculate the moving averages
short_ma = ta.sma(close, short_period)
long_ma = ta.sma(close, long_period)
// Plot the moving averages
plot(short_ma, color=color.blue, title="Short MA")
plot(long_ma, color=color.red, title="Long MA")
// Define the buy and sell conditions based on crossovers
buy_signal = ta.crossover(short_ma, long_ma)
sell_signal = ta.crossunder(short_ma, long_ma)
// Plot the buy and sell signals with labels (white text)
plotshape(buy_signal, location=location.belowbar, color=color.green, style=shape.labelup, title="Buy Signal", text="BUY", textcolor=color.white)
plotshape(sell_signal, location=location.abovebar, color=color.red, style=shape.labeldown, title="Sell Signal", text="SELL", textcolor=color.white)
// Optional: Background color to highlight the signals
bgcolor(buy_signal ? color.new(color.green, 90) : na, title="Buy Signal Background")
bgcolor(sell_signal ? color.new(color.red, 90) : na, title="Sell Signal Background")
Open-source script
In true TradingView spirit, the creator of this script has made it open-source, so that traders can review and verify its functionality. Kudos to the author! While you can use it for free, remember that republishing the code is subject to our House Rules.
Disclaimer
The information and publications are not meant to be, and do not constitute, financial, investment, trading, or other types of advice or recommendations supplied or endorsed by TradingView. Read more in the Terms of Use.