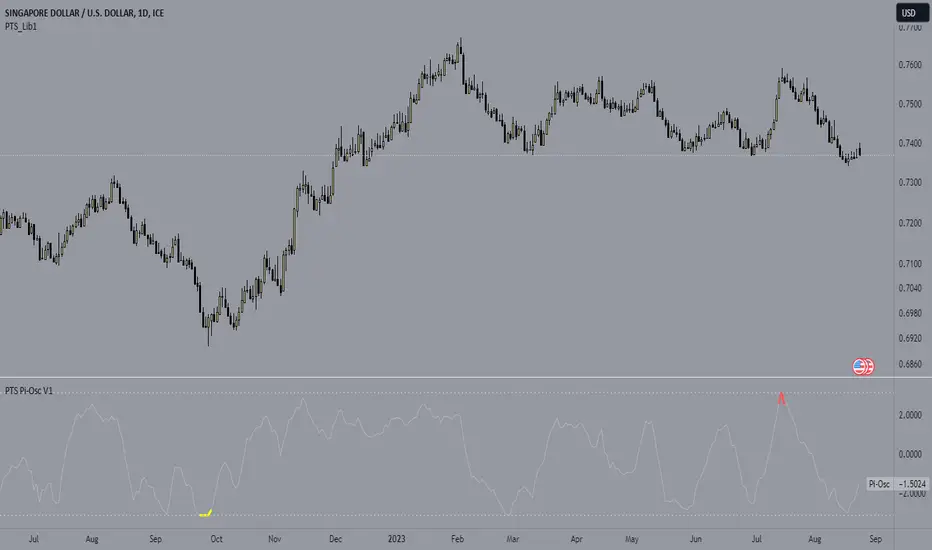
PTS Pi-Osc V1
The PTS - Pi-Osc know as Precision Index Oscillator by Roger Medcalf - Precision Trading Systems.
How does the Pi-Osc work?
Pi-Osc is a highly sophisticated consensus type indicator comprising of many different component signals.
A technical traders tool that measures everything from divergences to probabilities all blended into one simple to use product.
The buy and selling opportunities are highlighted by the moves away from + or - 3.14.
Simple to use for all levels of experience from beginner to expert and offers a unique edge in terms of precision.
The components that go into computations are identified below.
Money flow index provides a simple snapshot of how sold out or pumped up a stock or future really is and when measured in three different time frames gives a slick consensus view of money flow.
Relative strength index (RSI) still the No1 most popular indicator in use today as its power to identify overbought and oversold qualities in sideways markets is exceptional.
Its poor performance in trends is greatly reduced when seamlessly integrated with the PI-Osc algorithm.
Demand index being one of the designers favourite indicators for measuring the future direction caused by a large volume trade is incorporated here as well as its exceptional efficiency as a divergence indicator.
James Sibbet's creation provides an additional stellar incisive cutting accuracy to the Pi-Osc. Sibbets creation is one of the only indicators with true predictive qualities as a leading indicator.
Divergences. Pi-Osc measures divergences which occur over many look back periods from two different indicators, realising that divergences are often spurious in their reliability, the indicator only factors 4% of the total indicator
reading from these. Paradoxically the buy and sell zones have to have at least one observation of a divergence to trigger a signal.
Volume is always a factor that precedes a price change, as stock prices cannot move without a real money value being assigned to it either as a recent trade or a bid-offer order being placed.
The designer's understanding of volume patterns is a very useful addition incorporated into the Pi-Osc indicators unique conception.
Momentum frequently decelerates prior to market turning points and PI-osc is monitoring several timeframes of smoothed momentum samples in its calculations.
But unlike a conventional rate of change or momentum indicator the Pi-Osc indicator scores a neutral reading when momentum is rising or falling fast, and a reading is only factored into the output when momentum is reducing, thus
indicating a higher probability of success.
Probability is another feature of this algorithm.
Although rarely used in industry standard oscillators, the designer has added a standard deviation (2.9) factor into this indicator as the more usual 2 standard deviations used in Bollinger bands is just not reliable enough to bet hard earned cash on.
Normally distributed price sets have a 99.9% containment within 3.3 standard deviations, so when this is breached the Pi-Osc adds or deducts a further value to its output number.
Stochastics have similar attributes to RSI oscillators and have contributed a factor into PI-osc due to their smooth and reliable ability to identify buying and selling points in non trending markets.
Price patterns. Generally the industry standard oscillators just use the closing price to calculate their values, and although some indicators such as the stochastic use the high and low in their mathematics, few oscillators are actually programmed to respond to unique candlestick chart set ups.
PI-osc is setting the standard with its intelligent programming to recognise when the current chart pattern is shouting buy signals. Several of the more reliable patterns are factored into the algorithm.
When all the maths is done, Pi-Osc does an exceptional job of determining true buying and selling points.
Basically the trading interpretation is made very simple for you, as the buy and sell zones are so logically determined, not by one factor but from a large consensus "vote" from more than one different computation.
The benefits of this indicator are that it saves valuable time in "confirming technical analysis signals" and all trades know time is precious as large price changes can be missed in seconds while checking other confirming factors.
It takes the hard work out of it, and lets your computer do the brain work.
Ideally this indicator is best as an entry signal, and exits are best done with a trailing stop which has a logical trend following exit, as its quite rare that the Pi-Osc will run right to the other extreme and issue a reverse signal.
Precision Index Oscillator has now got a new rule as a result of the gradual rise in market volatility.
Apart from the other well known main rules to wait for the bounce away from Pi and trade in the direction of the major trend, the new rule is to experiment to find the best historical timeframe.
In the old days it would fire up very nicely on a 10 minute chart of most things, and still does (sometimes) but the futures markets and the very volatile cryptocurrencies now go way out of the old extremities in terms of deviations from the norm.
So it is essential to know what the market volatility is capable of on each instrument.
The point being made here is that using this on very short term time frames is not as safe as used to be.
Institutions enjoy working together to drive the prices into areas where most traders did not expect them to go, taking out all the stops and getting a better price for themselves.
So the first task after ordering this product is to create multiple minute chart settings in your Trading View platform and then click through them and there you will find hopefully find the holy grail, just like finding the best guitar,
amplifier and effects pedal settings for creating your own personalized type of music, finding the best timeframe to use you Pi-Osc is the essential work.
The holy grail usually turns out to be nothing more complex than a stop watch:
If the best setting turns out to be 15 minutes or 30 seconds on a volatile market or a 4 hours minute chart on a very volatile market then so be it.
Who cares? Does it matter?
All that matters is you find the way to get to the best results from this product.
Precision Index Oscillator has eight rules
1. Trade in the direction of the major trend
2. Find the time frame that has worked best in historical testing ( This can be a different setting for each market )
3. ALWAYS use a stop loss
4. Wait for the bounce away from Pi
5. Wait for the bounce away from Pi
6 Wait for the bounce away from Pi
7 Wait for the bounce away from Pi
8. Remember the other seven rules.
Precision Index Oscillator clarification of rules 3 to 7
This indicator can stay locked at the extreme Pi level for many bars, days, hours, minutes, seconds etc.
Taking the signal before the bounce comes is like the well known phrase "catching the falling knife".
Taking the signal before the bounce is a "Pi-Crime" and is a bad idea. Ignoring this point will likely result in losses
As Ed Seykota puts it in his usual amusing style, the problem with catching falling knives is that there are more knives than we have fingers.
He is referring to a market sell off rather than a sell off in one market.
When everything is crashing and we buy all of the crashing things at once, yes you guessed it: A painful day for the fingers!
Suggested settings for various lengths:
There are no settings to change. The beauty of Pi-Osc is there are no settings to be changed.
Your testing of "Pi signal qualifications" is confined only to selecting a time frame which appears to have offered good Pi-trades in the past.
This does not guarantee future signals will be good, and this is why risk control is essential.
Of course it is smart to experiement with different time periods of chart.
Execution of trades:
Exercise caution with this product.
Risk control is essential and risking more than 1% to 1.5% of your capital from entry price to stop would NOT be advised:
As with hunting, firing out lots of small trades in a shot gun approach will lead to better results than gambling all on the first signal you see.
There is much more chance of hitting a bird with a shot gun than a canon and the ammunition is much cheaper.
Always always use a stop loss. Something like 3 to 7 times a fifty period average true range for example.
Whilst it is often possible that a Pi-bounce appears exactly at the precise high or low of the week and could be the only one you see it is risky just to pile into it instantly as some markets produce several failed signals which continue to move in the same direction.
The safest and least risky method is to wait for the trend to change after the Pi-bounce. This is subjective to your own definition of how to measure the trend as "changing" but I would suggest waiting for a 8-20 period Exponential average to turn around before entering a trade.
Once the trade is entered you can implement a trailing stop to allow maximum potential gains and if your style is one of wanting to take quick profits then it is wise to take only some partial profits and give the move a chance to go somewhere and exit the remainder when the trend changes.
If the move was picked up near the absolute top or bottom it could be a large mistake to bail out of all of it early.
Market selection is important:
Avoid markets in endless smooth trends. These are best trading with trend following products ( Pi-Osc is not a trend following product )
Look for a choppy up or down trend or sideways market with some cycle qualities to it.
Best results are on liquid markets, you can observe the past signals and often history repeats with the good previous signals tending to indicate that future signals may also be good. (This is not certain of course)
This is also true of a market showing several historically bad signals which may be leading to more bad signals.
If the past performance of this indicator is poor on the market you are viewing, then move to another market until one is found where the readings show good price action after the signals in historical data.
Time frames:
This product can be applied to any time frame of market but be aware as is stated above, the slower time frames yield more valid signals and shorter time frames lead to more randomness and noise ridden plots of lower significance.
That said, it provides a valid reason to enter a trade and can give good results providing good stops and risk control are used. I have seen plenty of valid signals on 30 second charts right up to weekly charts.
The reliability of short term intra day time frames is usually lower than weekly or daily time frames. As 10 minute time frame is more reliable than a 30 second chart.
Please take this into consideration, try slowing down the impulses to go fast.
I am now accepting payments in USD or CHF for this product
This is not because I expect a US Dollar collapse but as a precaution to spread currency risk over different classes.
As FX rates vary substantially you can find the option that is cheaper than the other and it is fine to do that and choose the cheaper payment option.
Thanks for reading and I hope you do well with Pi-Osc on Trading View, just remember all the eight rules. You do remember them don't you?
Roger Medcalf - Precision Trading Systems
Invite-only script
Only users approved by the author can access this script. You'll need to request and get permission to use it. This is typically granted after payment. For more details, follow the author's instructions below or contact PrecisionTradingSystems directly.
TradingView does NOT recommend paying for or using a script unless you fully trust its author and understand how it works. You may also find free, open-source alternatives in our community scripts.
Author's instructions
Disclaimer
Invite-only script
Only users approved by the author can access this script. You'll need to request and get permission to use it. This is typically granted after payment. For more details, follow the author's instructions below or contact PrecisionTradingSystems directly.
TradingView does NOT recommend paying for or using a script unless you fully trust its author and understand how it works. You may also find free, open-source alternatives in our community scripts.