PROTECTED SOURCE SCRIPT
Updated Combined BTC Futures vs. Spot {C_S}
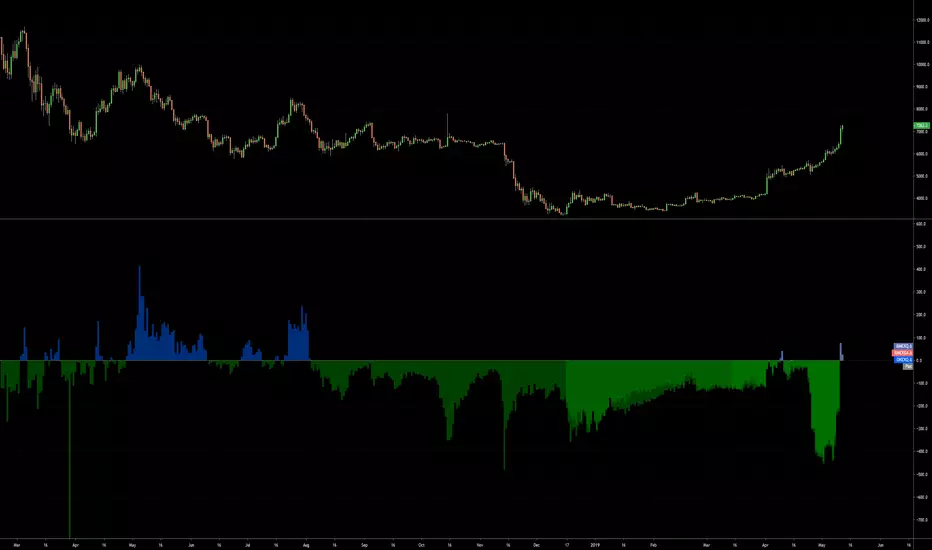
I built a baseline histogram chart that allows you to quickly view OKEX, BITMEX Quarts, and BITMEX Bi-Annuals versus spot. Colors are all editable, and you can change to area/line if youd like!
Let me know if you have any questions or suggestions!
Let me know if you have any questions or suggestions!
Release Notes
Updated to current contractsRelease Notes
Dictation editProtected script
This script is published as closed-source. However, you can use it freely and without any limitations – learn more here.
Disclaimer
The information and publications are not meant to be, and do not constitute, financial, investment, trading, or other types of advice or recommendations supplied or endorsed by TradingView. Read more in the Terms of Use.
Protected script
This script is published as closed-source. However, you can use it freely and without any limitations – learn more here.
Disclaimer
The information and publications are not meant to be, and do not constitute, financial, investment, trading, or other types of advice or recommendations supplied or endorsed by TradingView. Read more in the Terms of Use.