OPEN-SOURCE SCRIPT
Candle Breakdown with Solid Tops/Bottoms
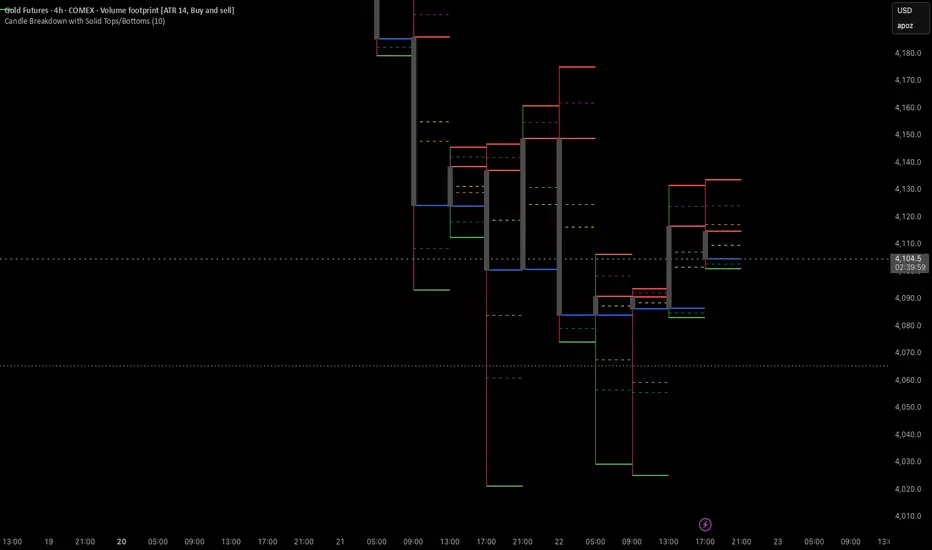
I incorporate this indicator on a 4hr chart and use the previous candle levels as support resistane/ targets/pivots for trades on the 1 min.
This Pine Script v5 indicator for TradingView, named "Candle Breakdown with Solid Tops/Bottoms," visually dissects each candlestick into four sections: whole candle (low to high), top wick (body top to high), body (open to close), and bottom wick (low to body bottom). For each section, it plots:Solid horizontal lines (width=2) at the top and bottom (e.g., high/low for whole candle, body top/bottom for body).
Dashed horizontal midlines (width=1) at the midpoint of each section (e.g., (high + low)/2 for whole candle).
Key features include:
Toggles: Enable/disable each section (whole, top wick, body, bottom wick) via checkboxes.
Custom Colors: Separate color inputs for top/bottom lines and midlines (defaults: gray, red, blue, green for sections; orange, purple, yellow, teal for midlines).
Lookback: User-defined input (default 10 candles) limits lines to the last N candles for clarity.
Labels: Optional price labels on the last bar for debugging.
The script uses line.new() for dynamic, per-candle lines, ensuring no errors (e.g., no invalid linestyle or linewidth<1). It’s efficient (up to 12 lines/candle, stays under max_lines_count=500) and works on any symbol/timeframe, enhancing swing trading analysis (e.g., for GC1! or NQ1!).
Open-source script
In true TradingView spirit, the creator of this script has made it open-source, so that traders can review and verify its functionality. Kudos to the author! While you can use it for free, remember that republishing the code is subject to our House Rules.
Disclaimer
The information and publications are not meant to be, and do not constitute, financial, investment, trading, or other types of advice or recommendations supplied or endorsed by TradingView. Read more in the Terms of Use.