OPEN-SOURCE SCRIPT
Updated TargetPredictor 5MA Forecast

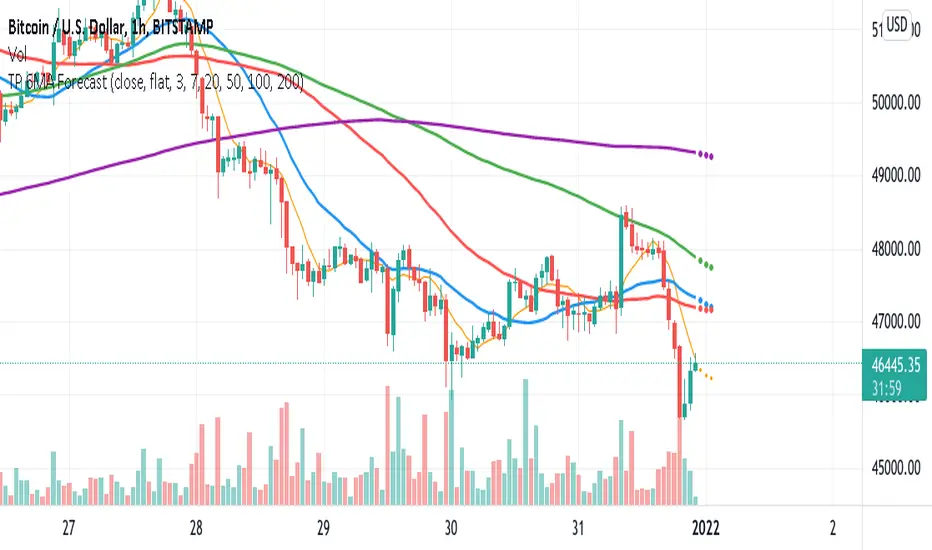
This indicator consists of five moving averages. 7, 20, 50, 100 and 200.
Moving averages usually represent dynamic supports or resistances and are very useful in trading.
In addition, this indicator predicts where these moving averages will be located three candlesticks ahead and predicts their projected movement.
I hope you enjoy it and enjoy using it.
Moving averages usually represent dynamic supports or resistances and are very useful in trading.
In addition, this indicator predicts where these moving averages will be located three candlesticks ahead and predicts their projected movement.
I hope you enjoy it and enjoy using it.
Release Notes
Removed surce settingADDED:
TP River option
This option consists of two exponential moving averages 144 and 169.
Exponential Moving averages usually represent dynamic supports or resistances and are very useful in trading.
How does this works?
It can be used in uptrend or downtrend.
In Uptrend:
As a particular currency grows, we are most interested in where the peak will be reached. In this case, we use the hourly time frame and when it falls below both exponential moving averages this means that there is a possibility that the trend will reverse in a negative direction. Confirmation that the trend has turned in a negative direction is obtained if the candlesticks fall below both exponential moving averages at a 4-hour time frame and then at a daily time frame. If this happens, the trend changes from uptrend to downtrend.
So, a 1 hour interval first alerts us to the impending danger of a trend reversal.
Downtrend:
If we want to see when the downward trend will change into growth, we must also be interested in shorter time frames. When it exceeds both exponential moving averages at 1 hour time frame, this is the first sign of an impending trend reversal. When it then exceeds the 4-hour time frame and then the daily time frame, the upward trend change is confirmed.
Open-source script
In true TradingView spirit, the creator of this script has made it open-source, so that traders can review and verify its functionality. Kudos to the author! While you can use it for free, remember that republishing the code is subject to our House Rules.
Disclaimer
The information and publications are not meant to be, and do not constitute, financial, investment, trading, or other types of advice or recommendations supplied or endorsed by TradingView. Read more in the Terms of Use.