OPEN-SOURCE SCRIPT
Updated Crypto Bands with Tools

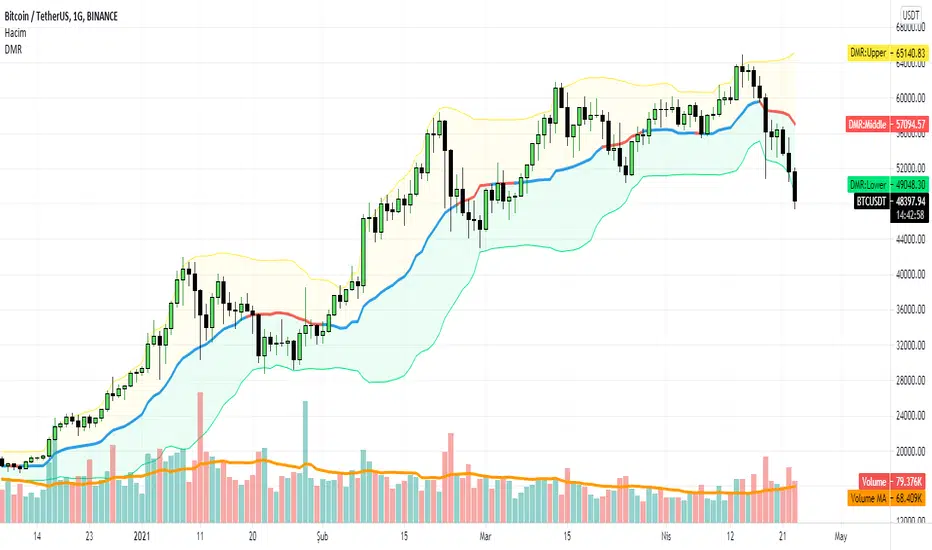
This indicator has 3 bands
1. Upper Band
2. Middle Band
3. Lower Band

1. Upper Band
Average of Moving Average of the Close (add Standard Deviations) and Highest price reached in the prior period
2. Middle Band
Average of upper and middle bands. And middle band also has BUY-SELL function. If middle band is blue you can BUY and if the middle band colored red you can SELL
3. Lower Band
Average of Moving Average of the Close(subtract Standard Deviations) and Lowest price reached in the prior period
Upper and Lower bands can be used for BUY&SELL strategy.
You can buy when price touches the lower band
You can sell when price touches the upper band

Indicator can work with long and short positions aswell

As you can see when price touches the lower band you can be LONG
and when the price touches the upper band you can be SHORT
When stock prices continually touch the upper DMR Band, the prices are thought to be overbought; conversely, when they continually touch the lower band, prices are thought to be oversold, triggering a buy signal. When using DMR Bands, designate the upper and lower bands as price targets.
indicator has ichimoku and some moving averages for checking the support and resistances.
1. Upper Band
2. Middle Band
3. Lower Band
1. Upper Band
Average of Moving Average of the Close (add Standard Deviations) and Highest price reached in the prior period
2. Middle Band
Average of upper and middle bands. And middle band also has BUY-SELL function. If middle band is blue you can BUY and if the middle band colored red you can SELL
3. Lower Band
Average of Moving Average of the Close(subtract Standard Deviations) and Lowest price reached in the prior period
Upper and Lower bands can be used for BUY&SELL strategy.
You can buy when price touches the lower band
You can sell when price touches the upper band
Indicator can work with long and short positions aswell
As you can see when price touches the lower band you can be LONG
and when the price touches the upper band you can be SHORT
When stock prices continually touch the upper DMR Band, the prices are thought to be overbought; conversely, when they continually touch the lower band, prices are thought to be oversold, triggering a buy signal. When using DMR Bands, designate the upper and lower bands as price targets.
indicator has ichimoku and some moving averages for checking the support and resistances.
Release Notes
Changed middle bands color codes.Release Notes
Bug FixesRelease Notes
Color ChangesOpen-source script
In true TradingView spirit, the creator of this script has made it open-source, so that traders can review and verify its functionality. Kudos to the author! While you can use it for free, remember that republishing the code is subject to our House Rules.
Disclaimer
The information and publications are not meant to be, and do not constitute, financial, investment, trading, or other types of advice or recommendations supplied or endorsed by TradingView. Read more in the Terms of Use.
Open-source script
In true TradingView spirit, the creator of this script has made it open-source, so that traders can review and verify its functionality. Kudos to the author! While you can use it for free, remember that republishing the code is subject to our House Rules.
Disclaimer
The information and publications are not meant to be, and do not constitute, financial, investment, trading, or other types of advice or recommendations supplied or endorsed by TradingView. Read more in the Terms of Use.