PROTECTED SOURCE SCRIPT
Checklist by Jaehee
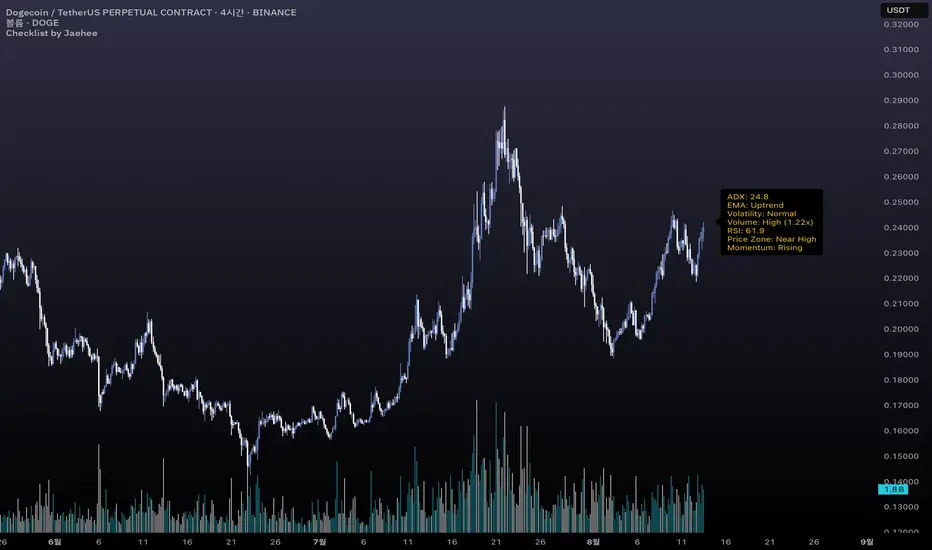
The checklist is a market context tool that consolidates seven key metrics into a single on-chart panel, helping traders quickly gauge market conditions without switching between multiple indicators.
1. Display Panel (7 metrics):
ADX: Trend intensity (Above 20 often indicates a stronger, more reliable trend)
EMA Structure: 5/20/60/120/240 EMA alignment (Uptrend, Downtrend, or Mixed state)
Volatility: ATR regime classification (High volatility may require wider stops)
Volume State: Relative to 20-bar SMA with spike multiple (High volume often confirms price moves)
RSI: Current RSI(14) value (Above 70 = overbought zone, below 30 = oversold zone)
Price Zone: Location within the last 20-bar range (Near High, Mid, or Near Low)
Momentum Slope: MACD histogram slope (Rising suggests building momentum; Falling suggests fading momentum)
2. Purpose & Use:
Designed for traders—especially beginners—who want to speed up market scanning.
Keeps a concise, standardized “checklist” visible on the right side of the chart.
Use as a contextual reference, not as an entry/exit signal.
3. Features:
Compact label HUD anchored to the chart’s right margin.
Automatic refresh on each bar close with only one label to avoid clutter.
Works on any timeframe and symbol that supports OHLCV data.
Protected script
This script is published as closed-source. However, you can use it freely and without any limitations – learn more here.
Disclaimer
The information and publications are not meant to be, and do not constitute, financial, investment, trading, or other types of advice or recommendations supplied or endorsed by TradingView. Read more in the Terms of Use.