OPEN-SOURCE SCRIPT
Candle Range Theory
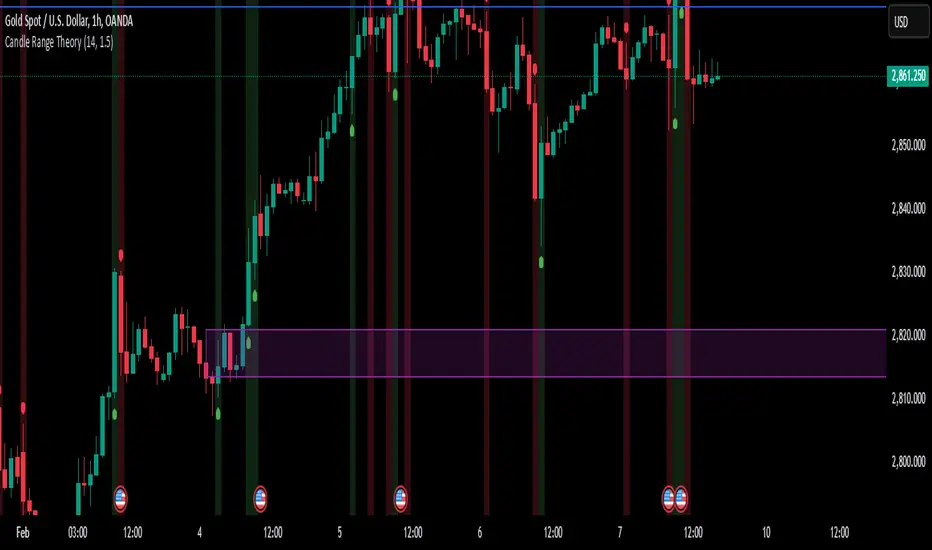
Candle Range Analysis:
Calculates the true range of each candle
Shows a 14-period SMA of the range (adjustable)
Dynamic bands based on standard deviation
Visual Components:
Colored histogram showing range deviations from mean
Signal line for oscillator smoothing
Expansion/contraction zones marked with dotted lines
Arrow markers for extreme range conditions
Key Functionality:
Identifies range expansion/contraction relative to historical volatility
Shows normalized range oscillator (-100% to +100% scale)
Includes visual and audio alerts for extreme range conditions
Customizable parameters for sensitivity and smoothing
Interpretation:
Red zones indicate above-average volatility/expansion
Green zones indicate below-average volatility/contraction
Crossings above/below zero line show range expansion/contraction
Signal line crossover system potential
Open-source script
In true TradingView spirit, the creator of this script has made it open-source, so that traders can review and verify its functionality. Kudos to the author! While you can use it for free, remember that republishing the code is subject to our House Rules.
Disclaimer
The information and publications are not meant to be, and do not constitute, financial, investment, trading, or other types of advice or recommendations supplied or endorsed by TradingView. Read more in the Terms of Use.