OPEN-SOURCE SCRIPT
RSI back
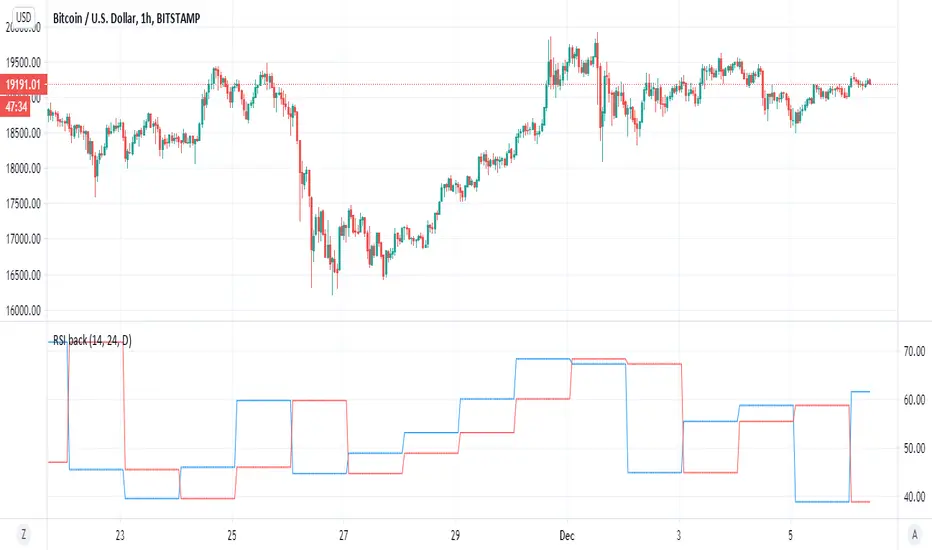
simple indicator that based on difference between current RSI and past RSI (historic)
so lets say if take 1 hour chart then in a day there are 24 hour
so our RSI back if we put close[24] will be the rsi of 24 hour before and this we compare it to the current rsi
if the current is above the past one then the signal is bullish , and vice versa. (similar logic to system of buy that based on close yesterday compare open of today)
so to this logic we can add no security MTF to make it nicer
blue line is current MTF RSI , red line is historic RSI based on the number of candles we choose
when blue over red is bullish ,red over blue is bearish
same on 4 hour mTF '1 hour chart and 24 candle back
Open-source script
In true TradingView spirit, the creator of this script has made it open-source, so that traders can review and verify its functionality. Kudos to the author! While you can use it for free, remember that republishing the code is subject to our House Rules.
Disclaimer
The information and publications are not meant to be, and do not constitute, financial, investment, trading, or other types of advice or recommendations supplied or endorsed by TradingView. Read more in the Terms of Use.