OPEN-SOURCE SCRIPT
Updated FTFC (The Strat)
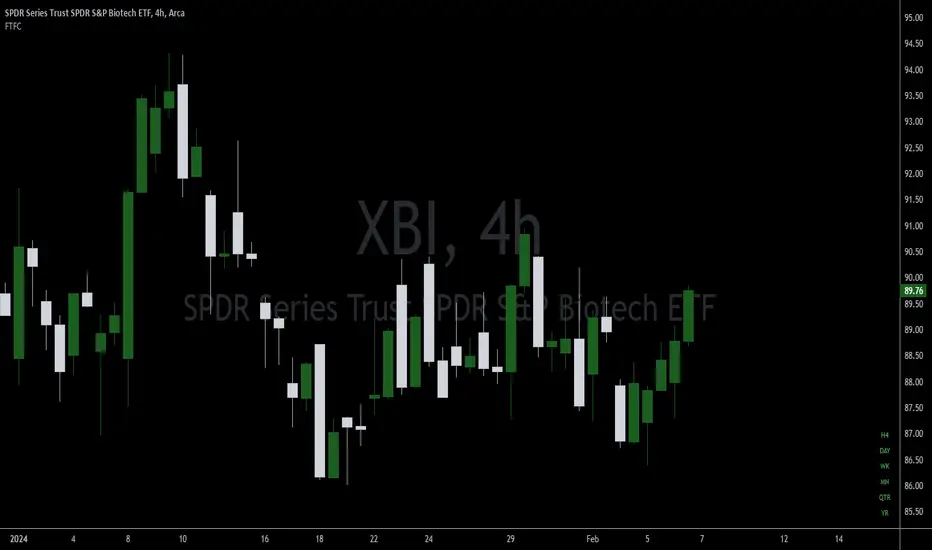
This indicator provides the status (red="down/short", green="up/long") of the current and higher timeframes in conjunction with The Strat, created by Rob Smith. In The Strat, Rob states that one should trade in the direction of timeframe continuity. What this means is if the majority of higher time frames are trading to the upside, one should only take long positions on the current timeframe. The more timeframes trading in the same direction increases the likelihood that a trade will work out in the trader's favor. The purpose of this indicator is to provide a visual cue as to when the current symbol has reached Full Timeframe Continuity (FTFC). For example, M5, M15, M30, H1 all green, only take long trades on the M5 time frame.
Release Notes
Added Quarterly and Yearly identifiers.Release Notes
Fixed an issue where Month and Week were not displaying correctly unless the chart was on that specific timeframe.Open-source script
In true TradingView spirit, the creator of this script has made it open-source, so that traders can review and verify its functionality. Kudos to the author! While you can use it for free, remember that republishing the code is subject to our House Rules.
Disclaimer
The information and publications are not meant to be, and do not constitute, financial, investment, trading, or other types of advice or recommendations supplied or endorsed by TradingView. Read more in the Terms of Use.
Open-source script
In true TradingView spirit, the creator of this script has made it open-source, so that traders can review and verify its functionality. Kudos to the author! While you can use it for free, remember that republishing the code is subject to our House Rules.
Disclaimer
The information and publications are not meant to be, and do not constitute, financial, investment, trading, or other types of advice or recommendations supplied or endorsed by TradingView. Read more in the Terms of Use.