OPEN-SOURCE SCRIPT
ES S/R Levels
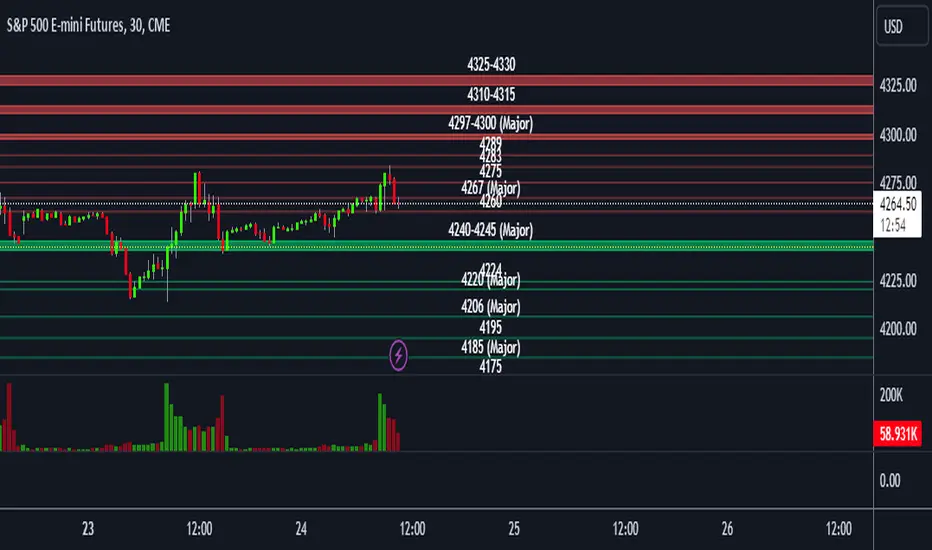
This script plots support and resistance levels for /ES on your chart.
This script only works on the /ES symbol in Tradingview due to the string manipulation of the levels.
You can input support and resistance levels in the inputs.
The example format of S/R levels should be in the following form (comma-separated)
If the level is a single point, it will draw a line. If the level is a range, it will draw a box.
4260, 4267, 4275, 4283, 4289, 4297-4300, 4310-15, 4325-30
You can also add the keyword (major) in your S/R levels input which will add a (Major) label to the drawing
4260, 4267 (major), 4275, 4283, 4289, 4297-4300 (major), 4310-15, 4325-30
Open-source script
In true TradingView spirit, the creator of this script has made it open-source, so that traders can review and verify its functionality. Kudos to the author! While you can use it for free, remember that republishing the code is subject to our House Rules.
Disclaimer
The information and publications are not meant to be, and do not constitute, financial, investment, trading, or other types of advice or recommendations supplied or endorsed by TradingView. Read more in the Terms of Use.