PROTECTED SOURCE SCRIPT
AlphaRadar - Fundamentals
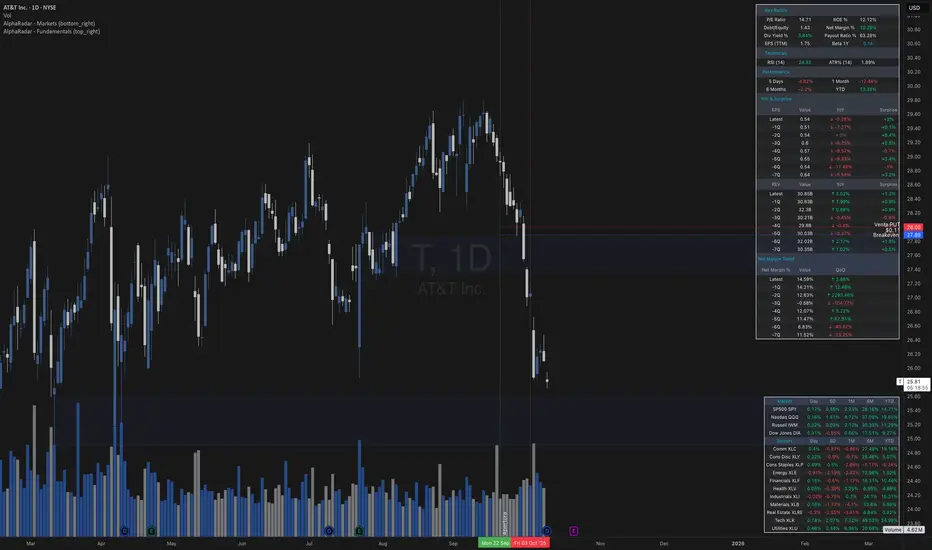
📊 MG ALPHA - FUNDAMENTALS PANEL
⚠️ IMPORTANT
🔴 This indicator MUST be used ONLY on DAILY (1D) timeframe. It will not work correctly on other timeframes.
Overview:
Comprehensive fundamental analysis panel displaying key metrics, earnings history, and profitability trends in a single view.
Features:
- Key Ratios: P/E, ROE, Debt/Equity, Net Margin (TTM), Dividend Yield, Payout Ratio, EPS (TTM), Beta 1Y
- Technicals: RSI (14), ATR% (14)
- Performance: 5D, 1M, 6M, YTD returns
- Earnings & Revenue: 8 quarters of EPS/REV with YoY growth and analyst surprises
- Net Margin Trend: 8 quarters showing profitability evolution (QoQ changes)
Color Signals:
🟢 Green: ROE >20%, Debt <0.5, Positive surprises, Rising margins
🔴 Red: ROE <10%, Debt >2, Negative surprises, Declining margins
🟡 Yellow: Payout Ratio 80-100% (caution)
Best For:
Fundamental analysis, earnings monitoring, long-term investing, company comparisons.
Notes:
- Data from TradingView financial database
- Auto-updates with new earnings releases
- Works best with US stocks (NYSE, NASDAQ)
- Free to use
🔔 Remember: Use DAILY (1D) charts only!
Protected script
This script is published as closed-source. However, you can use it freely and without any limitations – learn more here.
Disclaimer
The information and publications are not meant to be, and do not constitute, financial, investment, trading, or other types of advice or recommendations supplied or endorsed by TradingView. Read more in the Terms of Use.