The Diamond
Every Line explained:
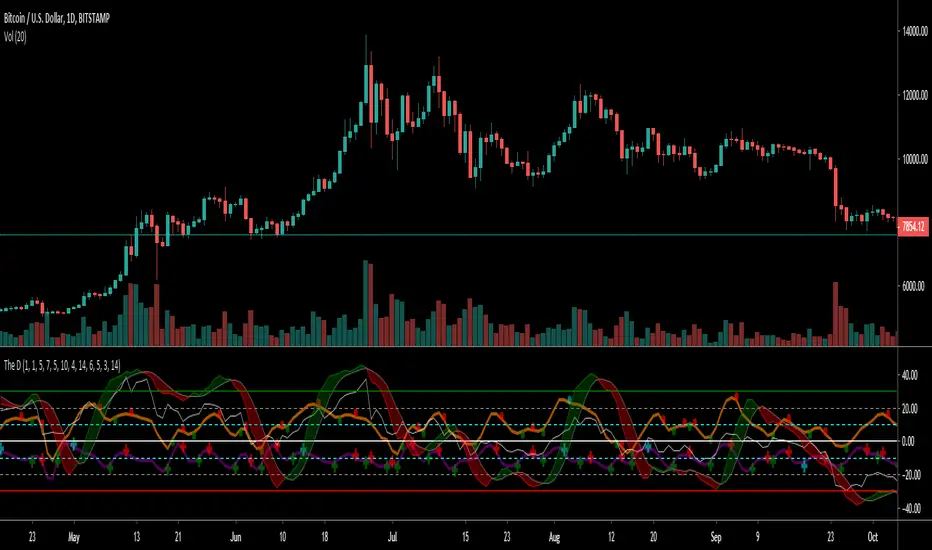
Orange line: The SMI(Swing Momentum Indicator) it is alternating oscillator between the value -10 and 40 and has its baseline at 10. It showing accumulation and increase of momentum and is used as a trend confirmation
Purple line: The BTD(Buy the Dip) is a modified Version of the SMI. It should be used in Bull or Bearflags to time entries. Also the Horizontal lines can be used as Support or Resistance
Green/Red Band: This one is a custom made stochastic. In its calculation it smoothing Tops/Lows to reduce noise. Also the look is better.
White line: Just a 14-lenght RSI. I use it together with the SMI and BTD to get confirmation
The Indicator is doing best in the crypto market. High market cap Coins/USDT Pairs do better than low market cap and btc pairs. Also it should be only used on timeframes greater than 4h. 6h and daily preferred. On higher time frames you need to adjust the values of the BTD and SMI.
Bearish divergence on both Indicators in a down trending market do give a good short entry.
Bullish divergence on the daily gives good swing entries in a downtrend
Invite-only script
Only users approved by the author can access this script. You'll need to request and get permission to use it. This is typically granted after payment. For more details, follow the author's instructions below or contact Dawn1234 directly.
TradingView does NOT recommend paying for or using a script unless you fully trust its author and understand how it works. You may also find free, open-source alternatives in our community scripts.
Author's instructions
Disclaimer
Invite-only script
Only users approved by the author can access this script. You'll need to request and get permission to use it. This is typically granted after payment. For more details, follow the author's instructions below or contact Dawn1234 directly.
TradingView does NOT recommend paying for or using a script unless you fully trust its author and understand how it works. You may also find free, open-source alternatives in our community scripts.