OPEN-SOURCE SCRIPT
EMA Cross EMA 21 50

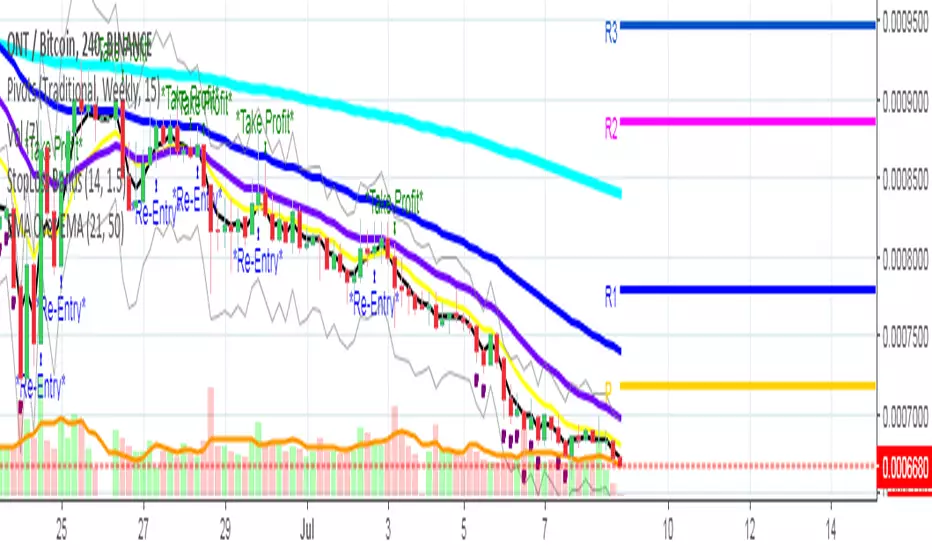
This script marks trending analisys when EMA 21 crosses EMA 50 in order to stablish a bullish or bearish trend. Also shows entry and quit points depending of EMA 3 crosses EMA 9.
EMA 200 is showed in order to take a better analisys of in or out
Also when RSI is down 30 level a purple flag is showed and an orange flag when 80 level is crossed up
This script works better in 4 hrs period
EMA 200 is showed in order to take a better analisys of in or out
Also when RSI is down 30 level a purple flag is showed and an orange flag when 80 level is crossed up
This script works better in 4 hrs period
Open-source script
In true TradingView spirit, the creator of this script has made it open-source, so that traders can review and verify its functionality. Kudos to the author! While you can use it for free, remember that republishing the code is subject to our House Rules.
Disclaimer
The information and publications are not meant to be, and do not constitute, financial, investment, trading, or other types of advice or recommendations supplied or endorsed by TradingView. Read more in the Terms of Use.