OPEN-SOURCE SCRIPT
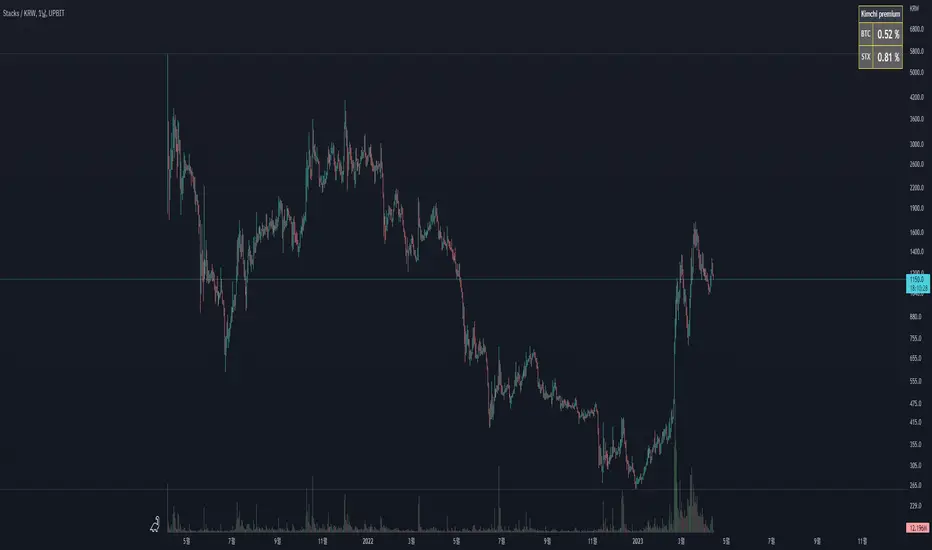
Updated Kimchi Premium watch

This indicator provides easy-to-see Kimchi premium information.
It provides three pieces of information.
1. Current premium
2. The highest value of the premium over the last 240 candlesticks in the current timeframe.
3. The highest value of the premium over the last 240 candlesticks in the current timeframe.
I think this script is a very simple indicator.
It is usually recommended to get value in a large time frame.
The basic operation formula is as follows.
premium(percent) = ( BTC KRW - ( BTC USDT x USD KRW ) / ( BTC USDT x USDT USD x USD KRW )) x 100
Thank you.
Release Notes
Add missing percentage text.Release Notes
add headerchange width
Release Notes
- Wording change- Added variables for the interval to find the maximum and minimum
Release Notes
No longer supports local maximum and local minimum.If the current ticker is one of the krw, usd, or usdt pairs, offer a premium for that ticker.
- For the krw ticker, prioritize Binance usdt for comparison.
- For usdt and usd tickers, prioritize upbit charts for comparison.
- If the chart is not supported for either pair, the corresponding premium will not be output.
- If a ticker that has stopped trading is in the comparison target, the value may come out strange.
Release Notes
busd supportedbug fix
* It is technically difficult to get the full name by symbol name.
Therefore, exception handling is not possible if the items are different but the front part of the symbol name is the same.
Release Notes
I used binanceus usdt in the calculation, but it looks like there is a problem. If you need it later, you can manage it separately in the input.Open-source script
In true TradingView spirit, the creator of this script has made it open-source, so that traders can review and verify its functionality. Kudos to the author! While you can use it for free, remember that republishing the code is subject to our House Rules.
Disclaimer
The information and publications are not meant to be, and do not constitute, financial, investment, trading, or other types of advice or recommendations supplied or endorsed by TradingView. Read more in the Terms of Use.
Open-source script
In true TradingView spirit, the creator of this script has made it open-source, so that traders can review and verify its functionality. Kudos to the author! While you can use it for free, remember that republishing the code is subject to our House Rules.
Disclaimer
The information and publications are not meant to be, and do not constitute, financial, investment, trading, or other types of advice or recommendations supplied or endorsed by TradingView. Read more in the Terms of Use.