OPEN-SOURCE SCRIPT
Expected Daily Range @shrilss

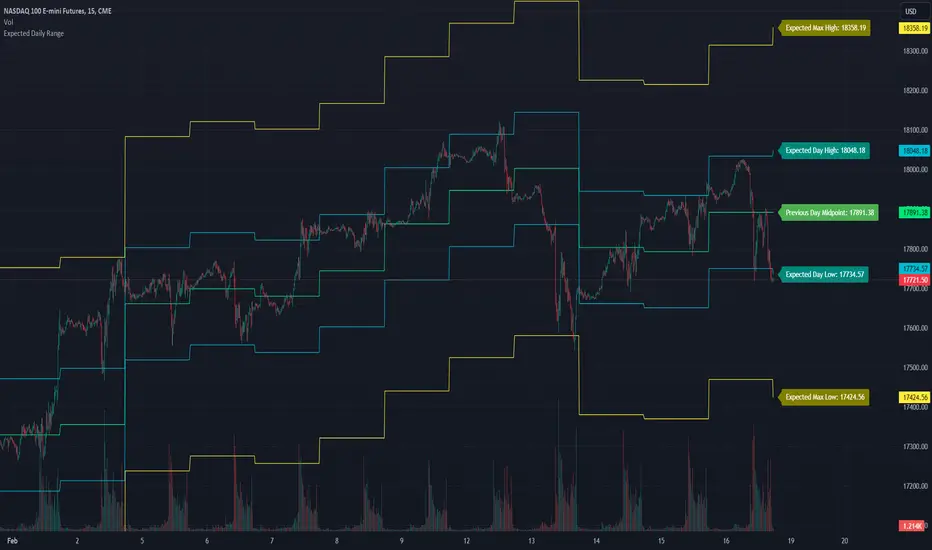
This indicator provides traders with insights into potential price movements based on statistical analysis of historical data. It calculates expected high and low price levels for the current trading day, as well as maximum expected high and low levels, aiding traders in setting appropriate entry and exit points.
This indicator utilizes the previous day's open and close prices to establish a midpoint, around which the expected price range is calculated. By factoring in a user-defined standard deviation multiplier, traders can adjust the sensitivity of the expected price levels to market volatility.
The script plots the previous day's midpoint, along with the expected high and low price levels for the current day. Additionally, it offers insights into potential maximum price fluctuations by plotting the maximum expected high and low levels.
Open-source script
In true TradingView spirit, the creator of this script has made it open-source, so that traders can review and verify its functionality. Kudos to the author! While you can use it for free, remember that republishing the code is subject to our House Rules.
Disclaimer
The information and publications are not meant to be, and do not constitute, financial, investment, trading, or other types of advice or recommendations supplied or endorsed by TradingView. Read more in the Terms of Use.