OPEN-SOURCE SCRIPT
Early MACD Reversal Indicator
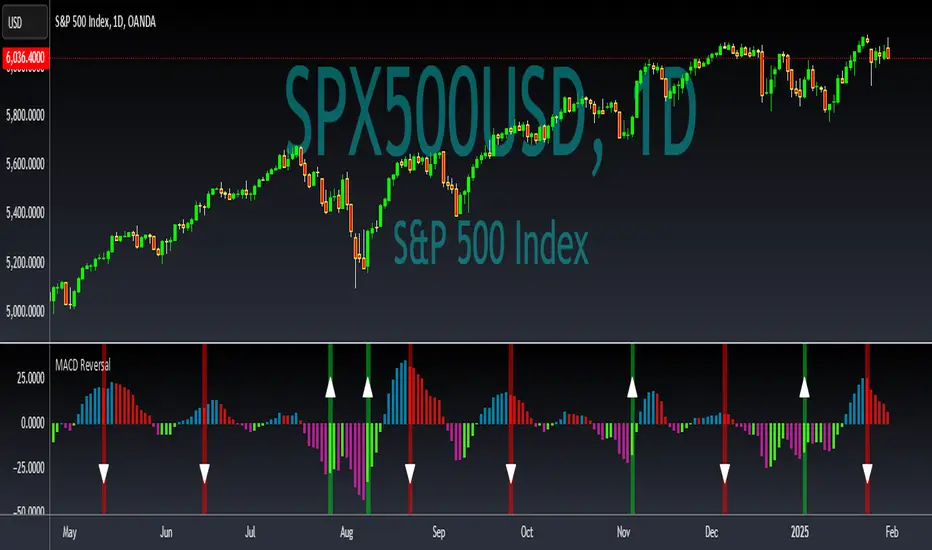
This indicator should provide early warnings of potential price reversal based on the difference between the MACD and its signal line. The keys of the reversal come from creating a histogram of the difference between the two lines and further monitoring the first indications of breadth decrease. The first change when trending up will paint a red vertical line and downward triangle to indicate potential trend reversal to the low side. The opposite with a green vertical line and upward triangle signals potential upside movement soon.
Enjoy!
Enjoy!
Open-source script
In true TradingView spirit, the creator of this script has made it open-source, so that traders can review and verify its functionality. Kudos to the author! While you can use it for free, remember that republishing the code is subject to our House Rules.
All forecasts are based on analysis of past behavior. Prior movements are not always indicative of future movement. Develop the theory, test the theory. Do your own research. Nothing in this analysis constitutes advice. YouTube For More. Good luck!!
Disclaimer
The information and publications are not meant to be, and do not constitute, financial, investment, trading, or other types of advice or recommendations supplied or endorsed by TradingView. Read more in the Terms of Use.