OPEN-SOURCE SCRIPT
Updated VWAP Reset Zones

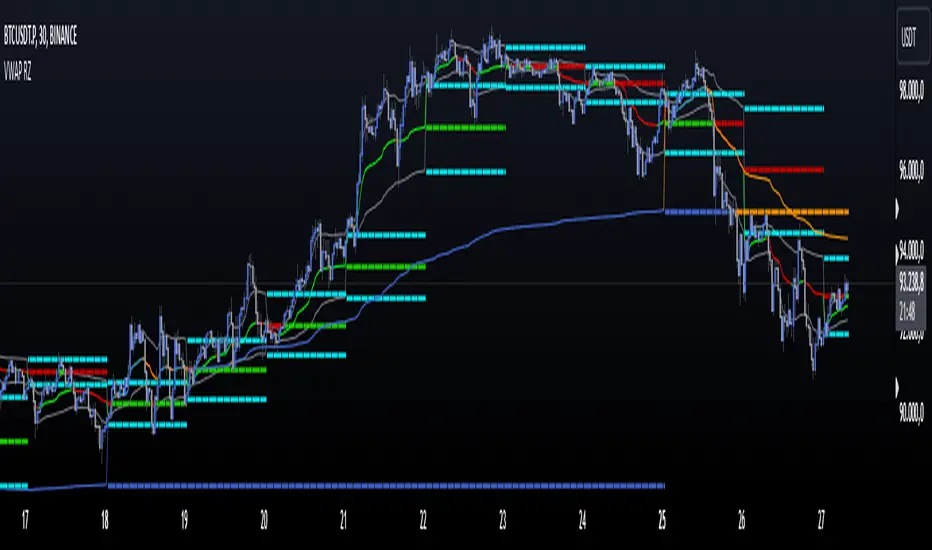
With this indicator, the VWAP is displayed based on two adjustable sources. Close and Open are recommended by default.
The zone between the Open and Close VWAP is carried over to the next day as the zone at the end of the period.
The zones can be considered as support and resistance zones.
The chart illustrates the idea behind it.
In addition, the anchor function has been added so that anchor points can be set for session, week and month.
Depending on the set anchor and the selected time unit of the chart, an adjustment of the indicator to the time unit can be made.
Recommended time unit of the indicator: Session = 15 min / Weekly = 1H / Month = 4H
In addition, the zones between VWAP close and vwap open have been colored.
Bullish when the close is above the open price and bearish when the close is below the open price.
The principle is simple. If the average closing price is below the average opening price, a downtrend is to be assumed and vice versa an uptrend.
Release Notes
The anchor of a year was also added. The recommended indicator timeframe is 1 dayRelease Notes
https://www.tradingview.com/x/tcT8AtR3/The data points for start and end points were made more precise to obtain more accurate zones. It is now no longer mandatory to choose an indicator time unit but still possible.
The start zones have also been added. So we have one support or resistance based on the VWAP start point and one on its end point.
Depending on the trading style, this can be used or interpreted differently.
Release Notes
New functionsTwo additional displays have been added:
1. the standard deviation bands have been added
https://www.tradingview.com/x/Upl1Vf7O/
2. reset zones have been added for the bands as well.
hrshttps://www.tradingview.com/x/Lg1eAQWO/
Both can be turned on or off separately to keep a better overview.
Depending on the time unit used, it is recommended to adjust the indicator time unit. Also not every anchor makes sense for every time unit. Try it out and see what happens when you adjust it.
Recommendations:
Session = 1 - 15 min / Indicator time setting = 1 min
Week = 30 min - 4 hrs / indicator setting = 15 min - 1 hr
Month or Year = 4 hrs - 1 week / Indicator setting = 1 - 4
Release Notes
The calculation of the reset zones has been revised. They now work for all installations regardless of whether 7/24 hours trading hours or only Monday to Friday.The code has been made much slower.
Release Notes
A second VWAP has been added to the script.The second VWAP can be set separately, but only the Reset and Start zones are displayed.
The display of the bands and their reset zones is only possible in the first VWAP. The display of these in the VWAP 2 exceeds the capacity of Pinescript because more than 64 lines would have to be drawn since the zones are calculated and filled on closing and opening rate.
https://www.tradingview.com/x/OwxEVoxq/
Release Notes
The script has been updated to Pinescript 6.The zones and the VWAP itself are now calculated on the price and are based on the standard source values.
The logic of calculating the zones based on High open Close Low has been removed.
Each line and fill can be set separately in the settings. Zones and bands can be activated in combination via the main settings. In general, the design can now be arranged more clearly.
The start zone of the VWAP has been removed.
Open-source script
In true TradingView spirit, the creator of this script has made it open-source, so that traders can review and verify its functionality. Kudos to the author! While you can use it for free, remember that republishing the code is subject to our House Rules.
Disclaimer
The information and publications are not meant to be, and do not constitute, financial, investment, trading, or other types of advice or recommendations supplied or endorsed by TradingView. Read more in the Terms of Use.