pi RSI Strategy
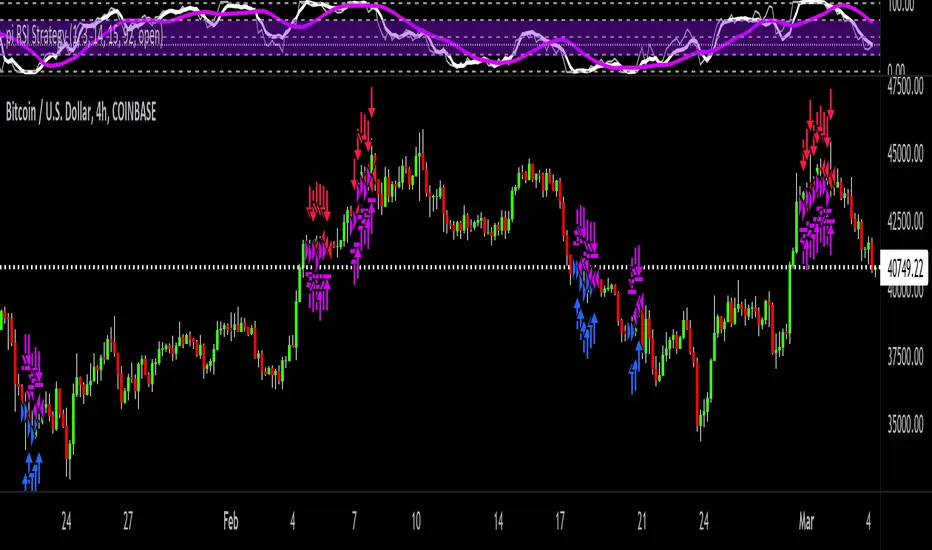
This is a price momentum strategy that helps you evaluate overbought or oversold conditions. By the default colors, when the white line is above the purple it's going bullish. And when the white line is under the purple it's going bearish.
Also, on the scale, 50 is neutral, below 25 is getting oversold and above 75 is getting overbought. This strategy is useful in conjunction with other price and volume indicators / strategies to help redundantly confirm future price action.
I've spent exhaustive effort on new research & development, engineering, back testing accuracy, real time capital testing, & future version revision of my trading indicator / strategy scripts.
Invite-only script
Only users approved by the author can access this script. You'll need to request and get permission to use it. This is typically granted after payment. For more details, follow the author's instructions below or contact Options360 directly.
TradingView does NOT recommend paying for or using a script unless you fully trust its author and understand how it works. You may also find free, open-source alternatives in our community scripts.
Author's instructions
tradingview.com/u/Options360/
Disclaimer
Invite-only script
Only users approved by the author can access this script. You'll need to request and get permission to use it. This is typically granted after payment. For more details, follow the author's instructions below or contact Options360 directly.
TradingView does NOT recommend paying for or using a script unless you fully trust its author and understand how it works. You may also find free, open-source alternatives in our community scripts.
Author's instructions
tradingview.com/u/Options360/