Dominator
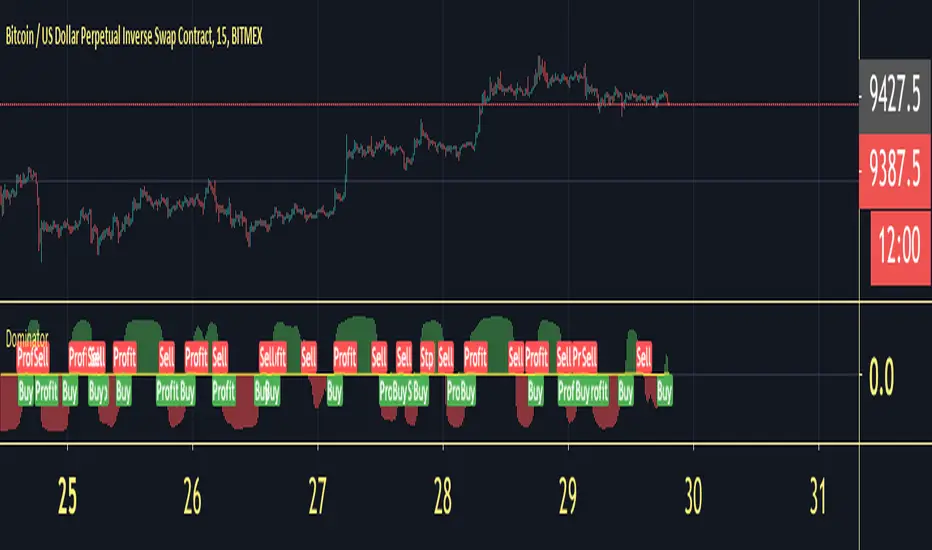
Dominator will give you the calculation of the wave between Bull&bear
How to use :
Long Alert signal = Bull Wave on the market
Short Alert signal = Bear wave on the market
Apply these fundamentals to any time frame and you will be able to read the correction into the trend or even the trend reversals.
Invite-only script
Only users approved by the author can access this script. You'll need to request and get permission to use it. This is typically granted after payment. For more details, follow the author's instructions below or contact Shenl0ng directly.
TradingView does NOT recommend paying for or using a script unless you fully trust its author and understand how it works. You may also find free, open-source alternatives in our community scripts.
Author's instructions
Disclaimer
Invite-only script
Only users approved by the author can access this script. You'll need to request and get permission to use it. This is typically granted after payment. For more details, follow the author's instructions below or contact Shenl0ng directly.
TradingView does NOT recommend paying for or using a script unless you fully trust its author and understand how it works. You may also find free, open-source alternatives in our community scripts.