OPEN-SOURCE SCRIPT
Updated % Sensitivity MA
Modifying an existing indicator is one thing, but creating an entirely new indicator is a totally different thing that involves even more creativity!
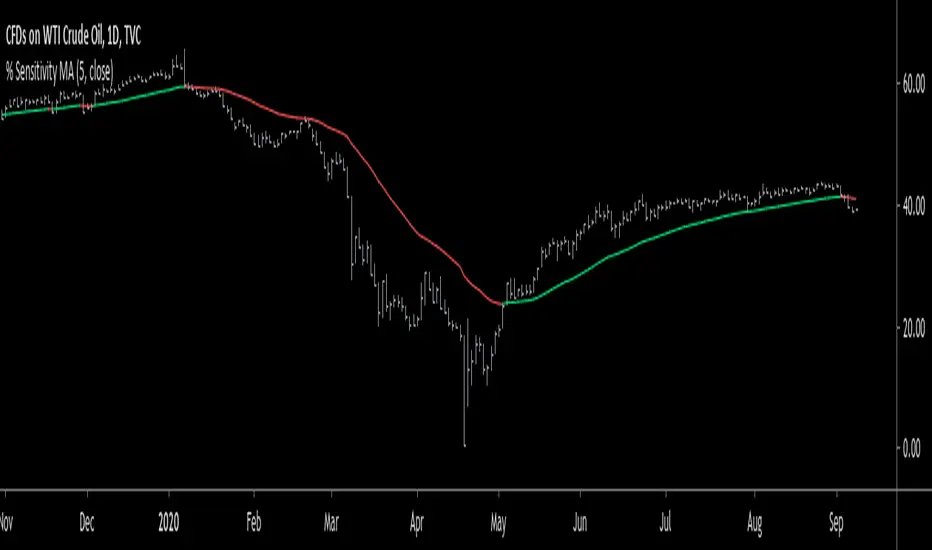
Today, I accomplished the latter by creating a brand new indicator. It's called "% Sensitivity MA". What does it do? Well, it's pretty much like any moving average, it tells you the trend. When the % Sensitivity MA is green, it's an uptrend, and vise versa for when it's red. Here's the calculation:
% Sensitivity MA (n,src) = ma.prev + (n/100) * (src - ma.prev)
where:
n - parameter that determines % sensitivity from 0 to 100.
src - parameter that determines the source. (default: close)
ma.prev - previous value of % Sensitivity MA.
Note:
- % Sensitivity MA has no parameter for lookback period.
- The n parameter is limited to a value between 0 and 100.
- Higher n values are more sensitive. (So, 100 is maximum sensitivity.)
- The value of the n parameter can have an unlimited number of decimal places. (making this indicator very precise!)
- I recommend n values closer to 0 than 100.
- For the source, I recommend closing prices.
Good luck, and enjoy!
Release Notes
>>>close > ma? ---> green if true, otherwise red.
Open-source script
In true TradingView spirit, the creator of this script has made it open-source, so that traders can review and verify its functionality. Kudos to the author! While you can use it for free, remember that republishing the code is subject to our House Rules.
Disclaimer
The information and publications are not meant to be, and do not constitute, financial, investment, trading, or other types of advice or recommendations supplied or endorsed by TradingView. Read more in the Terms of Use.