PROTECTED SOURCE SCRIPT
RGTS_TrendPower V2.0

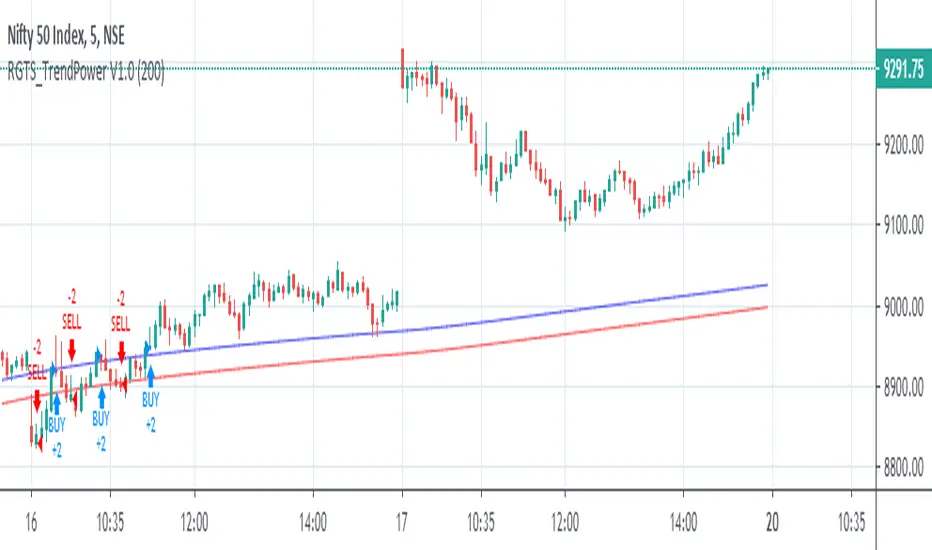
This Study is Based on High Low Band,
Buy-Sell Rules
Above Blue Line Trend Will Be Bullish, Buy Above Blue Line With Complet Breakout of Blueline
Below Blue Line Trend Wil Be Bearish, Sell Below Red Line With Complet Breakout of Red Line
Also, you can Change input From Setting to Check wich length Working fine for me,
I have Tested this Strategie in Indian Stock Market especially in NIFTY and BANKNIFTY index Future Trading
Speculation is Involved High Risk, Please test Strategie on Paper Before moving on Actual Trading
Thanks.
Protected script
This script is published as closed-source. However, you can use it freely and without any limitations – learn more here.
Disclaimer
The information and publications are not meant to be, and do not constitute, financial, investment, trading, or other types of advice or recommendations supplied or endorsed by TradingView. Read more in the Terms of Use.