OPEN-SOURCE SCRIPT
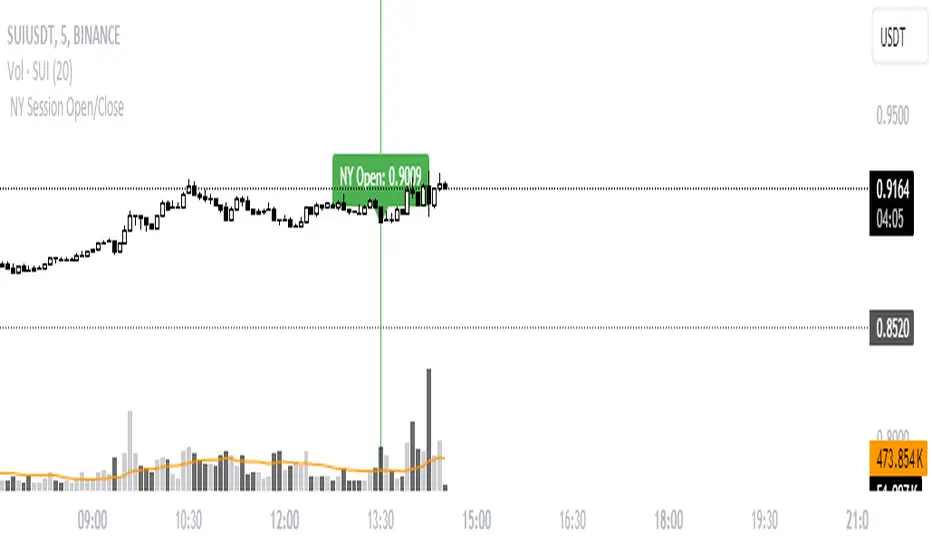
NY Session Open/Close
//version=5
indicator("New York Session Open/Close (Thin Lines)", overlay=true)
// Define the New York session open and close times (adjust for DST if necessary)
ny_open_time = timestamp("GMT-4", year, month, dayofmonth, 9, 30) // New York open at 9:30 AM EST
ny_close_time = timestamp("GMT-4", year, month, dayofmonth, 16, 0) // New York close at 4:00 PM EST
// Variables to store the open and close prices
var float ny_open_price = na
var float ny_close_price = na
// Plot thin vertical line for New York session open
if (time == ny_open_time)
ny_open_price := close
line.new(x1=bar_index, y1=low, x2=bar_index, y2=high, color=color.new(color.green, 0), width=1, extend=extend.both)
label.new(x=bar_index, y=ny_open_price, text="NY Open: " + str.tostring(ny_open_price), color=color.green, textcolor=color.white, style=label.style_label_down, yloc=yloc.price)
// Plot thin vertical line for New York session close
if (time == ny_close_time)
ny_close_price := close
line.new(x1=bar_index, y1=low, x2=bar_index, y2=high, color=color.new(color.red, 0), width=1, extend=extend.both)
label.new(x=bar_index, y=ny_close_price, text="NY Close: " + str.tostring(ny_close_price), color=color.red, textcolor=color.white, style=label.style_label_up, yloc=yloc.price)
Open-source script
In true TradingView spirit, the creator of this script has made it open-source, so that traders can review and verify its functionality. Kudos to the author! While you can use it for free, remember that republishing the code is subject to our House Rules.
Disclaimer
The information and publications are not meant to be, and do not constitute, financial, investment, trading, or other types of advice or recommendations supplied or endorsed by TradingView. Read more in the Terms of Use.