OPEN-SOURCE SCRIPT
Updated Volume x Price
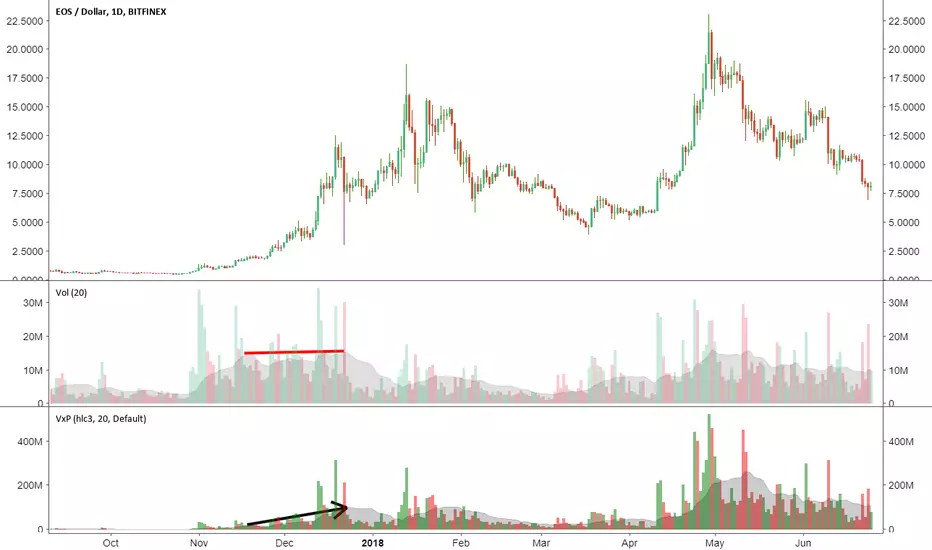
This is a simple indicator that calculates volume times price (money volume). Both asset volume and money volume are important indicators in TA. As you can see in the chart above, money volume (moving average) was increasing while the asset volume was not during late 2017. This could have led to wrong interpretations. Money volume becomes more important to consider when the difference in asset price is 'relatively' high.
Features:
- In addition to default options on volume indicator, it is possible to color volume bars based on "money flow multiplier" sign (close-(low+high)/2)
- Money factor can be disabled to show regular volume
Note: Most exchanges show asset volume but there are some like Bitmex that show money volume. Using this indicator on Bitmex type tickers should be avoided.
PS: I couldn't find any indicator for money volume so I had to develop this.
Your feedback is very welcome. If you know similar indicators, please let me know.
Release Notes
Fixed a bug related to Moving Average Length.Here is another interesting chart:
Open-source script
In true TradingView spirit, the creator of this script has made it open-source, so that traders can review and verify its functionality. Kudos to the author! While you can use it for free, remember that republishing the code is subject to our House Rules.
Disclaimer
The information and publications are not meant to be, and do not constitute, financial, investment, trading, or other types of advice or recommendations supplied or endorsed by TradingView. Read more in the Terms of Use.