OPEN-SOURCE SCRIPT
Financial Astrology Mars Speed

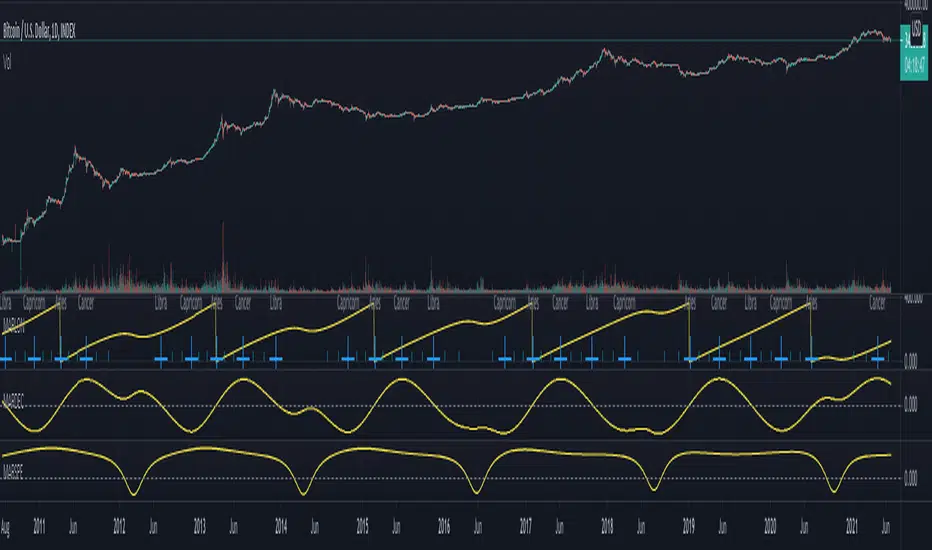
Mars speed phases (stationary and retrograde) seems to slow down the impulsive and energetic actions of traders, looking in the BTCUSD chart is very clear that during the period of Mars moving direct within the average speed around 0.6 degrees per day or above it, the price range is wider and the trend is more strong than when speed is decreasing below 0.50 degrees per day.
Surprisingly the price action acceleration don't happens at the maximum acceleration of Mars speed but after it reached the maxima around 0.75 to 0.76 degrees per day and stabilise around 0.7 for subsequent slow decrease through the course of few months to 0.62 - 0.58 daily speed range, during all this period the price action is strong. Once the Mars speed cross the 0.50 and goes into negative (in retrograde motion) the price suffers a congestion.
Note: The Mars speed indicator is based on an ephemeris array that covers years 2010 to 2030, prior or after this years the speed is not available, this daily ephemeris are based on UTC time so in order to align properly with the price bars times you should set UTC as your chart timezone.
Open-source script
In true TradingView spirit, the creator of this script has made it open-source, so that traders can review and verify its functionality. Kudos to the author! While you can use it for free, remember that republishing the code is subject to our House Rules.
Disclaimer
The information and publications are not meant to be, and do not constitute, financial, investment, trading, or other types of advice or recommendations supplied or endorsed by TradingView. Read more in the Terms of Use.