PROTECTED SOURCE SCRIPT
GTI Trend
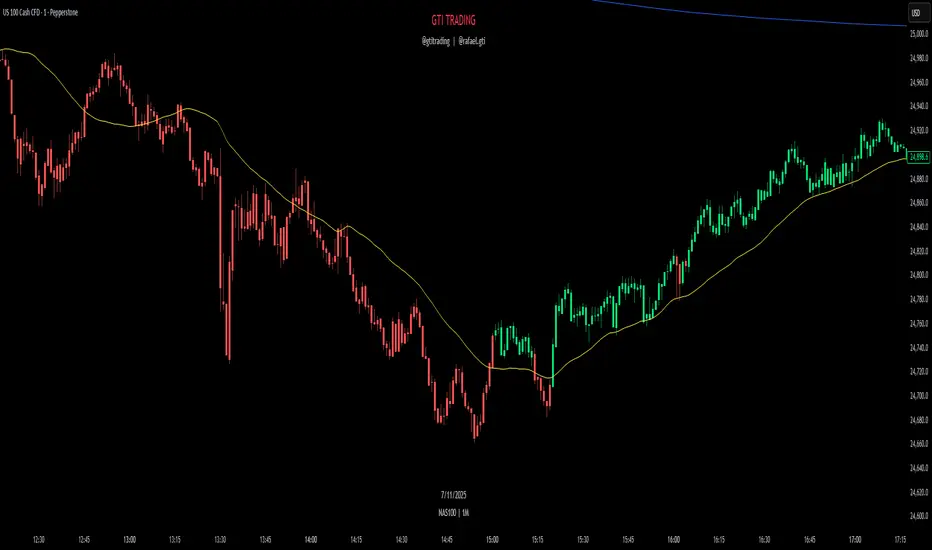
The GTI Trend is a trend-detection indicator that highlights potential market direction by coloring candles based on internal analysis of higher timeframe momentum and price action behavior.
Unlike simple moving average crossovers or RSI thresholds, GTI Trend uses a proprietary blend of price positioning logic and multi-timeframe validation. Specifically, it evaluates candle structures and key breakout zones from larger timeframes to determine whether short-term movements align with higher timeframe momentum — helping traders avoid false breakouts and identify real trend continuation zones.
The result is a real-time visual cue: green candles for bullish bias and red candles for bearish bias — tuned for lower timeframes like 1m, 3m, and 5m. This helps scalpers and short-term traders align entries with broader market structure.
How It Works
GTI Trend is built around the concept of directional alignment. It compares short-term price action against higher timeframe swing zones and dynamic reference levels. When price confirms breakout behavior while staying within those zones, the candle turns green or red accordingly. This avoids the lag often seen in classic indicators.
The system dynamically adapts to market volatility, making it particularly effective in fast-moving sessions like the New York Open (typically from 10:30 AM GMT -3).
Confluence Strategy
The GTI Trend is most effective when combined with a 38-period short-term moving average. If the candle is green and the price is above the MA, this confirms a bullish continuation. Conversely, a red candle below the MA may suggest a bearish reversal.
Pairing it with VWAP is also recommended, especially in index markets, as this highlights possible support/resistance zones to validate the signal.
Recommended Markets
The GTI Trend performs best on high-volatility assets such as NASDAQ, US30, SP500, Gold (XAUUSD), and the Brazilian mini index. However, it can be applied to any asset with sufficient price movement.
Protected script
This script is published as closed-source. However, you can use it freely and without any limitations – learn more here.
All content provided by GTI Trading is for informational & educational purposes only. Past performance does not guarantee future results.
Disclaimer
The information and publications are not meant to be, and do not constitute, financial, investment, trading, or other types of advice or recommendations supplied or endorsed by TradingView. Read more in the Terms of Use.