OPEN-SOURCE SCRIPT
Efficiency Ratio

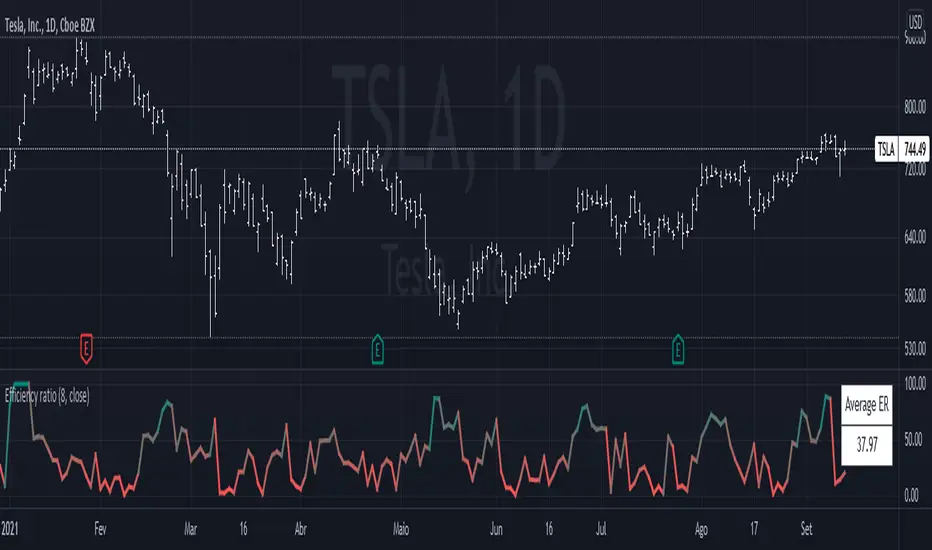
The efficiency ratio (ER) is described by Perry Kaufman in his book, Trading Systems and Methods.
It works by measuring the momentum of the market, that is, the absolute change from the current price to a past price, and divides it by the volatility, which is the sum of the absolute changes of each bar. That makes this a bounded indicator, going from 0 to 100, like an oscillator. Higher values mean less noise, while lower values mean more.
Eg.: if the market moves from 10.0 to 15.0 in a directional manner, with every bar up, the ER is going to be at 100. However, if it moves up and down, and goes all over the place until finally reaching 15.0, the ER is going to be at around 20. It is very difficult for the ER to be at zero, because that would require 0 volatility, which is almost impossible to occur.
This indicator is useful when planning for trades. If you notice the ER being higher than average, you may choose to increase the position size, because that would mean that the market is directional and has less chance of a whipsaw.
Open-source script
In true TradingView spirit, the creator of this script has made it open-source, so that traders can review and verify its functionality. Kudos to the author! While you can use it for free, remember that republishing the code is subject to our House Rules.
Disclaimer
The information and publications are not meant to be, and do not constitute, financial, investment, trading, or other types of advice or recommendations supplied or endorsed by TradingView. Read more in the Terms of Use.