OPEN-SOURCE SCRIPT
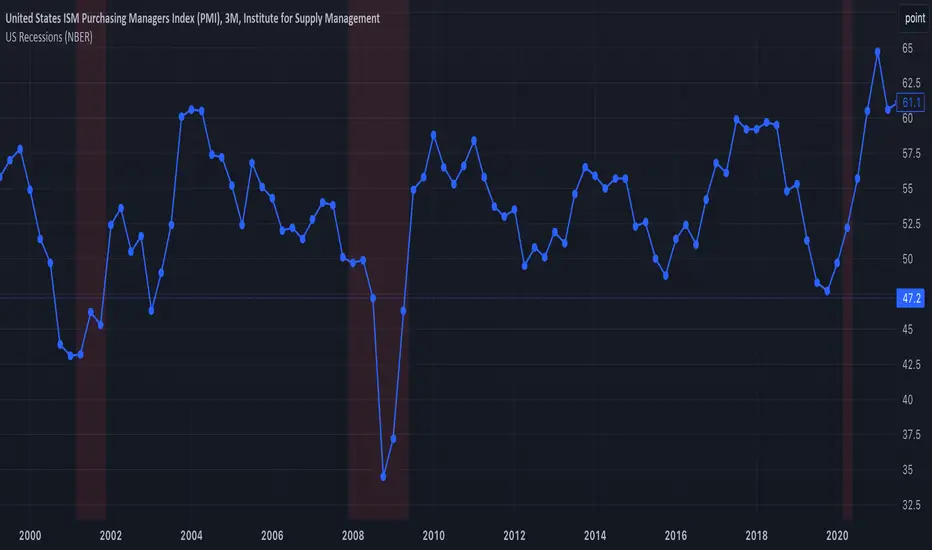
US Recessions (NBER)
This indicator is designed to replace the US Recessions indicator.
Unfortunately, the original indicator is now broken, and the author is not responding: tradingview.com/v/csfFrTe4/ .
There are other similar indicators, but they are not based on live data and either show non-officially recognized recessions or fail to display all officially recognized recessions.
This indicator shades US recession periods based on live monthly data from USREC. It highlights all officially recognized US recessions according to the NBER and will automatically shade any future recessions when they occur. The indicator works across all timeframes, correctly shading recessions whether you are viewing a 30-minute, 2-hour, daily, weekly, or any other chart timeframe.
Warning & Risks:
This indicator uses the barmerge.lookahead_on option to correctly handle monthly recession data from USREC. The purpose of this setting is to ensure that the monthly data points are applied retroactively to the corresponding bars on the chart. However, this means that while past recession periods are accurately shaded, the script is effectively displaying data from future candles and plotting it backward onto the chart.
This behavior does not introduce a “future leak” in the traditional sense—since USREC data is backward-looking and the current month always remains non-recessionary until officially confirmed. Nonetheless, it can cause confusion, as users may see recession periods shaded retroactively only after the data becomes available. Therefore, the current month will always appear non-recessionary until the next data point is released, and historical recession periods may be adjusted after the fact.
Open-source script
In true TradingView spirit, the creator of this script has made it open-source, so that traders can review and verify its functionality. Kudos to the author! While you can use it for free, remember that republishing the code is subject to our House Rules.
Disclaimer
The information and publications are not meant to be, and do not constitute, financial, investment, trading, or other types of advice or recommendations supplied or endorsed by TradingView. Read more in the Terms of Use.