OPEN-SOURCE SCRIPT
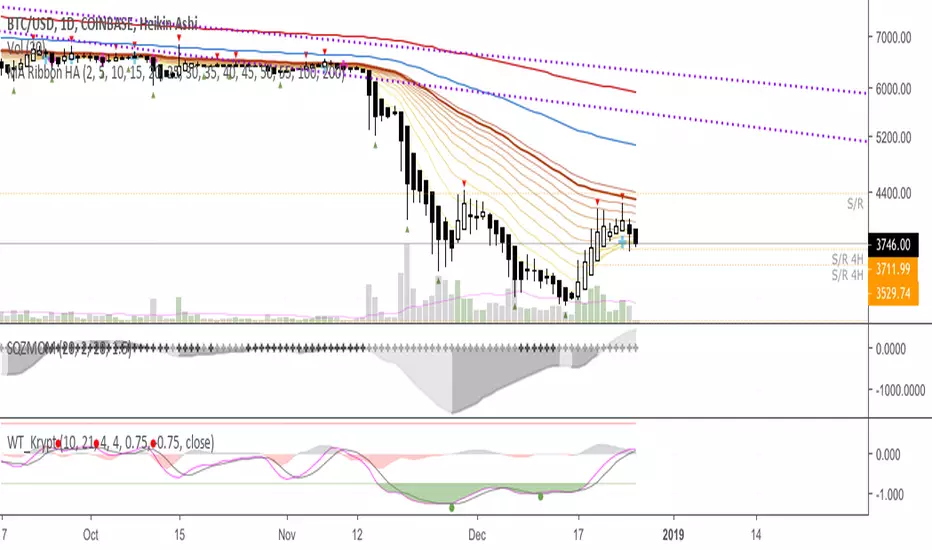
Updated MA Ribbon HA

* Inspired by Krypt's and Madrid's Ribbon
* Supplemental to bullish or bearish trend confirmations with Heikin Ashi candles (e.g. 10/20 MA cross)
* Default of: MA 5-55, 100 and 200
* Ability to switch between Simple vs Exponential MAs
You may switch color gradient by using this tool,
http://www.perbang.dk/rgbgradient/
Hope this helps. Please do let me know if you know how to script the wishlist below =)
Thanks!
---
Wishlist/to do next:
1. Be able to do this color change on counter-trend by implementing this script from Madrid's:
leadMAColor = change(ma05)>=0 and ma05>ma100 ? lime
: change(ma05)<0 and ma05>ma100 ? maroon
: change(ma05)<=0 and ma05<ma100 ? red
: change(ma05)>=0 and ma05<ma100 ? green
: gray
maColor(ma, maRef) =>
change(ma)>=0 and ma05>maRef ? lime
: change(ma)<0 and ma05>maRef ? maroon
: change(ma)<=0 and ma05<maRef ? red
: change(ma)>=0 and ma05<maRef ? green
: gray
2. Add this function from Krypt's to "Drop N candle":
dropn(src, n) =>
na(src[n]) ? na : src
...
price = dropn(src, dropCandles)
3. Be able to update line thickness of E/MA 10 & 20, as well as their colors.
4. A way to input two HEX colors and automatically update the ribbon lines to have those color gradient.
Release Notes
Added some lines from Madrid's Ribbon just as a way to remember what I'd want to implement or get some help implementing.Looking forward to help if this is easy for you. Much thanks in advance. Cheers!
Release Notes
* Added 10-20 MA Cross indicator* Added Fractals
Release Notes
Add separate cross indicators to distinguish a crossover signal to long or short.Release Notes
* Updated line thickness for 50, 100 and 200MAs* Modified color for 200MA to bold red
Open-source script
In true TradingView spirit, the creator of this script has made it open-source, so that traders can review and verify its functionality. Kudos to the author! While you can use it for free, remember that republishing the code is subject to our House Rules.
Disclaimer
The information and publications are not meant to be, and do not constitute, financial, investment, trading, or other types of advice or recommendations supplied or endorsed by TradingView. Read more in the Terms of Use.