PROTECTED SOURCE SCRIPT
Bottom Indicator
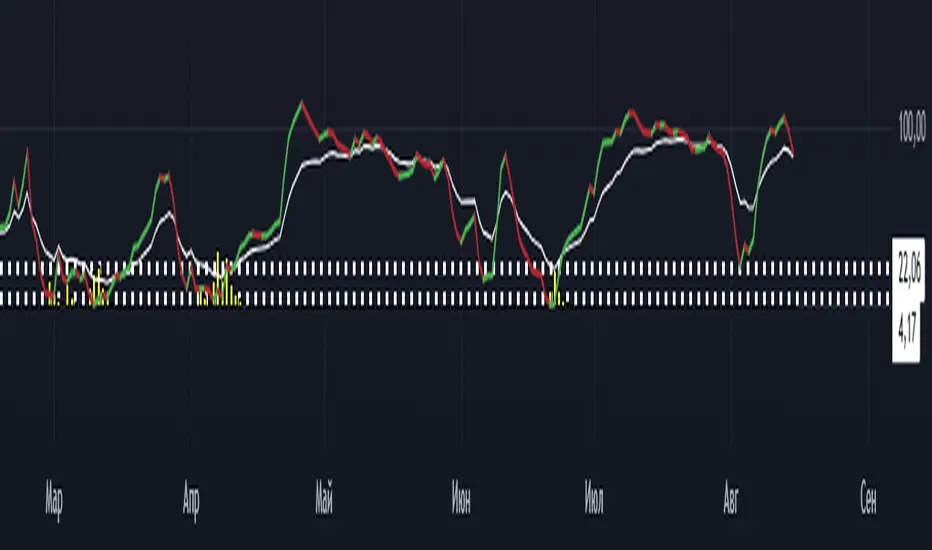
Indicator" identifies when the price is hitting local lows and large players might be stepping in (signaled by a yellow histogram). It overlays a KDJ oscillator and considers it a strong long signal if the purple (J) line is below 4, the white (K) line is below 22, and the yellow histogram is present. In other words, it spots a deeply oversold condition with big player activity as a prime buying opportunity.
Protected script
This script is published as closed-source. However, you can use it freely and without any limitations – learn more here.
Disclaimer
The information and publications are not meant to be, and do not constitute, financial, investment, trading, or other types of advice or recommendations supplied or endorsed by TradingView. Read more in the Terms of Use.