PROTECTED SOURCE SCRIPT
OBV Oscillator [CP]
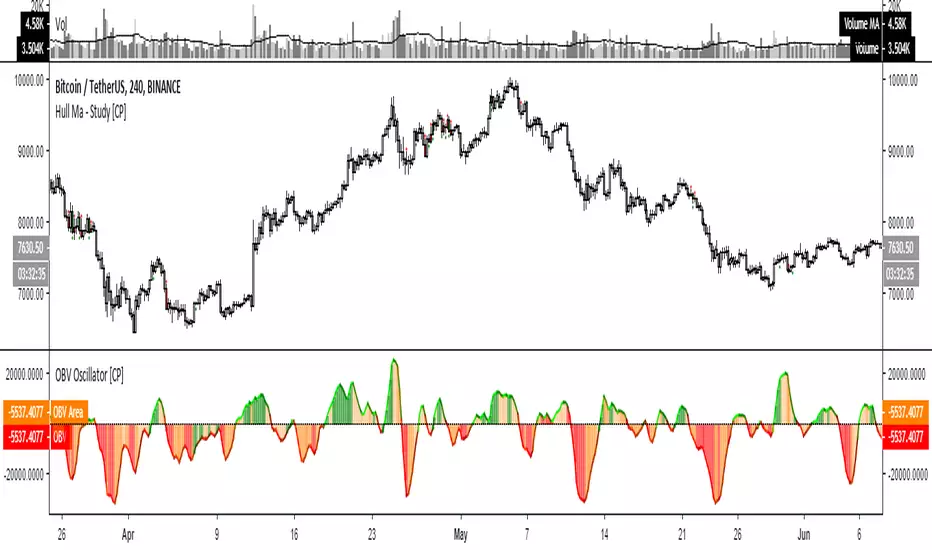
This is my version of the OBV Oscillator and I've used CCI to color the histogram
Line colors:
* Lime rising line above 0 line: Strong Bullish
* Green falling line above 0 line : Neutral Bullish
* Red falling line below 0 line : Strong Bearish
* Maroon rising line below 0 line : Neutral Bearish
Histogram colors:
*Green background above 0 line: Strong Bullish / Overbought
*Orange background above 0 line: Neutral Bullish
*Red background below 0 line: Strong Bearish / Oversold
*Orange background below 0 line: Neutral Bearish
Protected script
This script is published as closed-source. However, you can use it freely and without any limitations – learn more here.
Disclaimer
The information and publications are not meant to be, and do not constitute, financial, investment, trading, or other types of advice or recommendations supplied or endorsed by TradingView. Read more in the Terms of Use.