PROTECTED SOURCE SCRIPT
Updated Ultimate Average 3.0
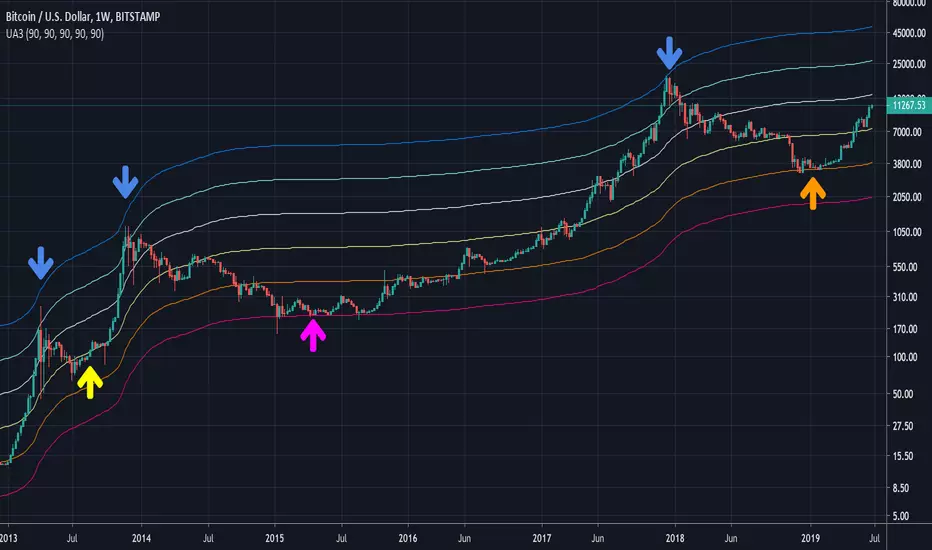
Purple = Actual average price over total timeframe.
Other lines are factors above the actual average.
A pattern emerges where the purple is hit, then a parabolic rise to the blue top, then the a drawback down to the orange, then parabolic, then drawback to yellow, then parabolic to blue, then a reset back to the purple line.
Other lines are factors above the actual average.
A pattern emerges where the purple is hit, then a parabolic rise to the blue top, then the a drawback down to the orange, then parabolic, then drawback to yellow, then parabolic to blue, then a reset back to the purple line.
Release Notes
updates timescale automationProtected script
This script is published as closed-source. However, you can use it freely and without any limitations – learn more here.
Disclaimer
The information and publications are not meant to be, and do not constitute, financial, investment, trading, or other types of advice or recommendations supplied or endorsed by TradingView. Read more in the Terms of Use.
Protected script
This script is published as closed-source. However, you can use it freely and without any limitations – learn more here.
Disclaimer
The information and publications are not meant to be, and do not constitute, financial, investment, trading, or other types of advice or recommendations supplied or endorsed by TradingView. Read more in the Terms of Use.