MeanRevert Matrix [StabTrading]
Leveraging complex algorithms that incorporate human emotions and mean reversion theory, this indicator is the first stage in a comprehensive system for identifying market entry points. Its versatility allows it to be applied across all charts and timeframes, providing traders with clear visual cues for trend analysis and decision-making.
This indicator is purposefully straightforward, allowing traders to observe how the different algorithms work in confluence. The MeanRevert Matrix can be customized to fit individual trading styles, particularly in terms of aggressiveness, making it adaptable to various market conditions. Working in tandem with the FloWave Oscillator, it offers an additional layer of confluence, ensuring that trading signals are more reliable.
💡 Features
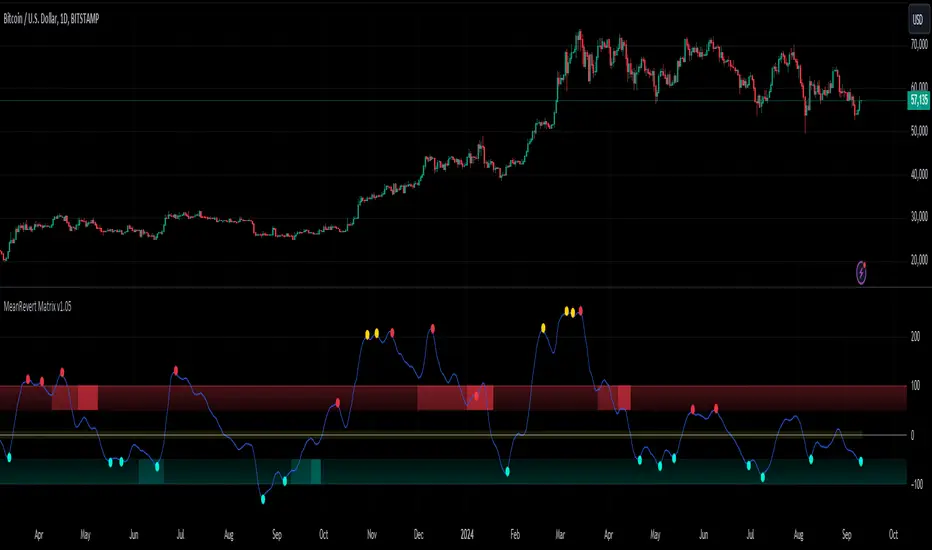
- Reversal Zones - These zones are integral to the MeanRevert Matrix, highlighting areas where trader emotions and money flow suggest potential longer-term reversals. The lighter shaded zones indicate early-stage reversals, while darker shades signal stronger reversal potential. This feature is designed to help traders anticipate market shifts and prepare for them accordingly.
- Localized Mean Reversion Signals - These signals are triggered when the price deviates significantly from the mean, unaffected by longer-term price movements. This localized algorithm helps traders focus on short-term market fluctuations without being influenced by broader trends.
- Yellow Signals - These signals identify isolated overbought or oversold conditions. While they often indicate reversal points, they can also signal the beginning of accelerated buying or selling, giving traders early warning of potential market shifts.
- Trading Style Customization - The MeanRevert Matrix allows traders to tailor their strategy by adjusting the indicator’s aggressiveness. A more aggressive setting will produce more frequent reversal signals, offering flexibility based on the trader’s risk tolerance and market outlook.
- Noise Eliminator - This feature helps traders filter out market noise or manipulation by increasing the noise value. By removing unwanted or misleading signals, it ensures that traders are acting on the most reliable data.
📈 Implementing the System
- Step 1 - Begin by observing the localized blue trend to identify reversal points below the mean. Green or red signals within this trend indicate that the price remains within the current market parameters, suggesting that a reversal may occur more quickly. Yellow signals, however, indicate that the trend is likely to continue, so it’s advisable to wait for clearer reversal zones to develop. To avoid misleading signals, consider using higher noise values.
- Step 2 - Wait for the reversal zone algorithm to indicate a potential market reversal by showing either light or dark red/green colour. A lighter zone suggests that the overall trend is beginning to reverse, while a darker zone indicates a higher likelihood of reversal.
- Step 3 - Once a reversal zone is identified, monitor the trend line for signals that the price is moving significantly away from the mean. This indicates a strong localized price movement that is poised for a reversal. At this stage, you can reduce the noise value and increase the aggressiveness of the trading style to capture more reversal signals.
🛠️ Usage/Practice
In the example above, the indicator is set with neutral aggression for buy signals and lower aggression for sell signals, reflecting the current bull market cycle
- Red Reversal Zone - A bearish reversal zone emerges, followed by a darker bearish zone, indicating an increased probability of a trend reversal. The red signals show price reversion from the localized mean, but the absence of yellow signals suggests the reversion isn't abnormally aggressive, making this a good area to consider a short position.
- Strong Reversal Opportunity - Similar to point 1, but this time a green signal appears within the bullish dark green zone, highlighting a strong reversal potential. Subsequent red signals suggest opportunities to take profits as the trend faces resistance.
- Opportunity to Strengthen Long Position - Once again, the indicator shows a bullish reversal zone without yellow signals. This suggests an area of increased resistance at this price point, offering traders another chance to increase their long positions before the market enters the long bull cycle.
- Excessive Buying Pressure - The price has deviated significantly from the mean, triggering a yellow signal. This indicates excessive buying pressure, suggesting the trend is likely to continue upward. Although not an immediate bearish area, the red sell signals suggest it could be a time to conservatively take partial profits.
- Trend Weakening - As the trend slows down, bearish zones appear, indicating potential reversal points. As the market shows signs of losing upward momentum, this suggests an opportunity to reduce their long exposure or enter a short trade and take advantage of the correction in the bull cycle.
- Potential for Additional Long Position - Despite the earlier sell signals, the overall uptrend remains strong. This presents an opportunity either to add to the long position or to take profits from a previous sell position. The strength of the upward trend suggests that the market may continue higher.
- Abnormal Upward Momentum - Similar to points 4 and 5, the yellow signals indicate abnormal price action with aggressive upward momentum. As the trend corrects to a normal range, the price hitting a resistance level is confirmed by the appearance of red reversal zones, suggesting a potential pullback.
- Sideways Market Signals - In a sideways market, the indicator shows signals that remain within the normal mean reversion range. These signals are not abnormal and suggest potential entry points for trades within a sideways market, indicating periods where the market lacks strong directional momentum.
🔶 Conclusion
With its seamless integration into various charts and timeframes, the MeanRevert Matrix stands as a reliable and adaptable tool, essential for navigating the complexities of modern markets. By following the implementation guidelines and leveraging its features, traders have the potential to effectively anticipate market movements and optimize their entry and exit points.
We developed this indicator to help traders enhance their understanding of market trends and achieve their trading objectives with greater precision.
Invite-only script
Only users approved by the author can access this script. You'll need to request and get permission to use it. This is typically granted after payment. For more details, follow the author's instructions below or contact StabTrading directly.
TradingView does NOT recommend paying for or using a script unless you fully trust its author and understand how it works. You may also find free, open-source alternatives in our community scripts.
Author's instructions
Disclaimer
Invite-only script
Only users approved by the author can access this script. You'll need to request and get permission to use it. This is typically granted after payment. For more details, follow the author's instructions below or contact StabTrading directly.
TradingView does NOT recommend paying for or using a script unless you fully trust its author and understand how it works. You may also find free, open-source alternatives in our community scripts.