Wizard Dynamic EMA Table
Track Multiple EMAs:
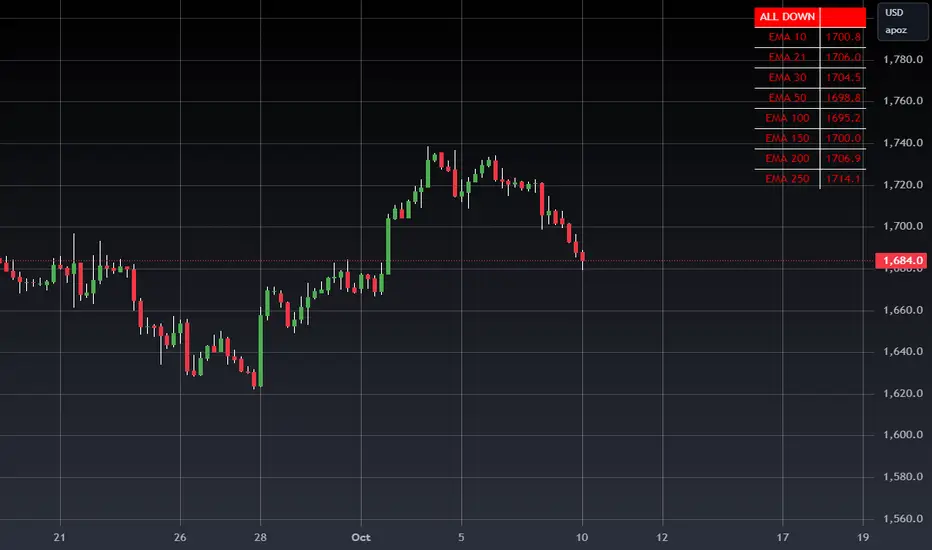
Displays 8 EMAs with their respective values.
Indicates whether each EMA is trending upward (green) or downward (red).
Summary Indicator:
A top cell provides a quick, overall trend:
Green ("ALL UP"): All EMAs are trending upward.
Red ("ALL DOWN"): All EMAs are trending downward.
Gray ("MIXED"): Some EMAs are up, and some are down.
Customizable:
The user can configure EMA periods to match their trading strategy.
Click Add to Chart (top-right corner of the Pine Editor).
The dashboard will appear on your chart.
How to Use the Dashboard
Monitor EMAs:
Look at the EMA table for real-time updates on each EMA's value and trend (up or down).
Quick Market Trend Analysis:
Check the summary cell at the top:
ALL UP (Green): Strong upward trend across all monitored EMAs.
ALL DOWN (Red): Strong downward trend across all monitored EMAs.
MIXED (Gray): Market is indecisive or ranging.
Customize EMA Periods:
Adjust the EMA periods from the script's settings:
Click the gear icon on the indicator in the chart legend.
Modify the EMA periods to match your trading strategy (e.g., 21, 50, 100, etc.).
Apply to Any Asset:
Use this script for any asset (stocks, forex, crypto, futures) available on TradingView.
Trading Strategies with the Dashboard
Trend-Following Strategy:
If the summary cell shows ALL UP, consider looking for long opportunities.
If the summary cell shows ALL DOWN, consider looking for short opportunities.
Reversal Strategy:
When the summary changes from ALL UP to MIXED or ALL DOWN, it might signal a weakening uptrend or potential reversal.
Confluence with Other Indicators:
Apply the dashboard to any timeframe (e.g., 1-minute, 1-hour, daily) depending on your trading style.
Benefits of Using This Script
Saves Time:
Quickly analyze trends across multiple EMAs without manually calculating or interpreting each one.
Visual Clarity:
The color-coded table provides instant insights into market conditions.
Customizable:
Tailor the EMA periods and apply it to any asset or timeframe.
"Disclaimer: This indicator is intended for educational purposes only and does not constitute financial advice. Trading involves significant risk, and users should perform their own research and consult with a licensed financial advisor before making any trading decisions."
Invite-only script
Only users approved by the author can access this script. You'll need to request and get permission to use it. This is typically granted after payment. For more details, follow the author's instructions below or contact WIZARDTRENDS directly.
Note that this private, invite-only script has not been reviewed by script moderators, and its compliance with House Rules is undetermined. TradingView does NOT recommend paying for or using a script unless you fully trust its author and understand how it works. You may also find free, open-source alternatives in our community scripts.
Author's instructions
Disclaimer
Invite-only script
Only users approved by the author can access this script. You'll need to request and get permission to use it. This is typically granted after payment. For more details, follow the author's instructions below or contact WIZARDTRENDS directly.
Note that this private, invite-only script has not been reviewed by script moderators, and its compliance with House Rules is undetermined. TradingView does NOT recommend paying for or using a script unless you fully trust its author and understand how it works. You may also find free, open-source alternatives in our community scripts.