OPEN-SOURCE SCRIPT
Dual Moving Average with Dots
Overview:
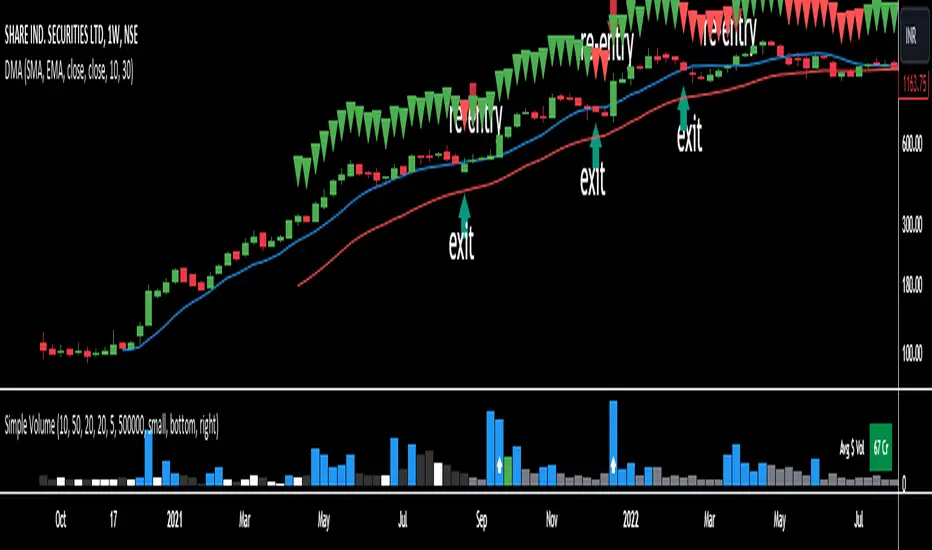
The Dual Moving Average with Dots is a powerful technical analysis tool designed to assist traders in identifying potential trend reversals and confirming trend strength. This indicator combines the simplicity of dual moving averages with visual markers in the form of dots above candles, providing clear signals for both trend following and reversal opportunities.
Key Features:
How to Use:
Usage Tips:
The Dual Moving Average with Dots is a powerful technical analysis tool designed to assist traders in identifying potential trend reversals and confirming trend strength. This indicator combines the simplicity of dual moving averages with visual markers in the form of dots above candles, providing clear signals for both trend following and reversal opportunities.
Key Features:
- Dual Moving Averages:
Choose between Simple Moving Average (SMA) and Exponential Moving Average (EMA) for two distinct moving averages.
Customize the source for each moving average, including options such as open, close, high, low, and more.
Adjust the periods for both moving averages to suit your trading preferences. - Visual Signals:
Green Dot: A green triangle-up dot appears above candles where the closing price is greater than both selected moving averages. This signals potential bullish strength and trend continuation.
Red Dot: A red triangle-down dot appears above candles where the closing price is lower than either of the selected moving averages. This signals potential bearish weakness and trend reversal. - Flexible Configuration:
Tailor the indicator to your trading strategy by adjusting parameters such as moving average type, source, and period for each average.
Gain insights into market dynamics by visually interpreting the relationship between closing prices and moving averages.
How to Use:
- Trend Confirmation:
Confirm a bullish trend when the green dot appears above a candle, suggesting that the closing price is above both moving averages.
Confirm a bearish trend when the red dot appears above a candle, suggesting that the closing price is below either of the moving averages. - Reversal Signals:
Watch for potential trend reversals when red dots appear, signaling that the closing price is below one of the moving averages. - Customization for Strategy:
Experiment with different combinations of moving average types, sources, and periods to align the indicator with your unique trading strategy.
Usage Tips:
- Combine the Dual Moving Average with Dots with other technical indicators for comprehensive market analysis.
- Look for confluence with support/resistance levels or chart patterns to enhance the robustness of your trading decisions.
Open-source script
In true TradingView spirit, the creator of this script has made it open-source, so that traders can review and verify its functionality. Kudos to the author! While you can use it for free, remember that republishing the code is subject to our House Rules.
Disclaimer
The information and publications are not meant to be, and do not constitute, financial, investment, trading, or other types of advice or recommendations supplied or endorsed by TradingView. Read more in the Terms of Use.