OPEN-SOURCE SCRIPT
GLB — Green Line Breakout Indicator (v6)
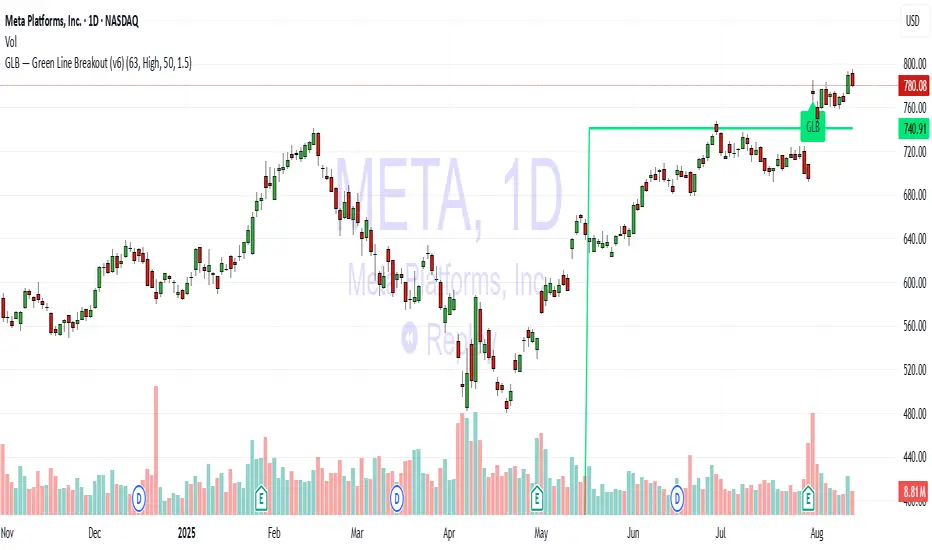
Understanding the GLB Strategy
According to Dr. Wish:
• GLB identifies stocks that hit a new all time high (ATH) and then consolidated (i.e., did not close above that high) for at least three months, forming what he calls the "green line."
• A breakout occurs when the stock closes above that green line level, often confirming strong buying interest and momentum (wishingwealthblog.com, wishingwealthblog.com).
Open-source script
In true TradingView spirit, the creator of this script has made it open-source, so that traders can review and verify its functionality. Kudos to the author! While you can use it for free, remember that republishing the code is subject to our House Rules.
Disclaimer
The information and publications are not meant to be, and do not constitute, financial, investment, trading, or other types of advice or recommendations supplied or endorsed by TradingView. Read more in the Terms of Use.