OPEN-SOURCE SCRIPT
Support and Resistance Heatmap
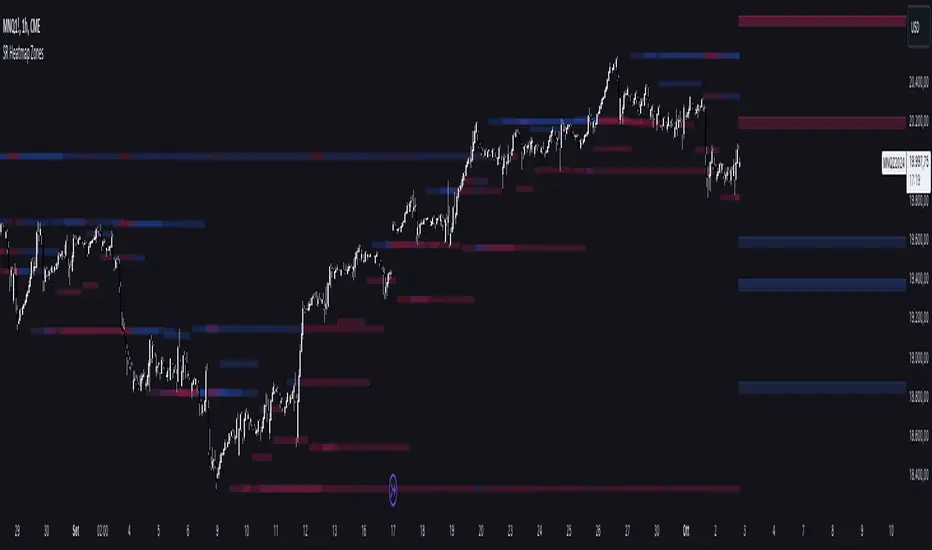
The "Support and Resistance Heatmap" indicator is designed to identify key support and resistance levels in the price action by using pivots and ATR (Average True Range) to define the sensitivity of zone detection. The zones are plotted as horizontal lines on the chart, representing areas where the price has shown significant interaction. The indicator features a customizable heatmap to visualize the intensity of these zones, making it a powerful tool for technical analysis.
Features:
Dynamic Support and Resistance Zones:
Identifies potential support and resistance areas based on price pivots.
Zones are defined by ATR-based thresholds, making them adaptive to market volatility.
Customization Options:
Heatmap Visualization: Toggle the heatmap on/off to view the strength of each zone.
Sensitivity Control: Modify the zone sensitivity with the ATR Multiplier to increase or decrease zone detection precision.
Confirmations: Set how many touches a level needs before it is confirmed as a zone.
Extended Zone Visualization:
Option to extend the zones for better long-term visibility.
Ability to limit the number of zones displayed to avoid clutter on the chart.
Color-Coded Zones:
Color-coded zones help differentiate between bullish (support) and bearish (resistance) levels, providing visual clarity for traders.
Heatmap Integration:
Gradient-based color changes on levels show the intensity of touches, helping traders understand which zones are more reliable.
Inputs and Settings:
1. Settings Group:
Length:
Determines the number of bars used for the pivot lookback. This directly affects how frequently new zones are formed.
Sensitivity:
Controls the sensitivity of the zone calculation using ATR (Average True Range). A higher value will result in fewer, larger zones, while a lower value increases the number of detected zones.
Confirmations:
Sets the number of price touches needed before a level is confirmed as a support/resistance zone. Lower values will result in more zones.
2. Visual Group:
Extend Zones:
Option to extend the support and resistance lines across the chart for better visibility over time.
Max Zones to Display (maxZonesToShow):
Limits the maximum number of zones shown on the chart to avoid clutter.
3. Heatmap Group:
Show Heatmap:
Toggle the heatmap display on/off. When enabled, the script visualizes the strength of the zones using color intensity.
Core Logic:
Pivot Calculation:
The script identifies support and resistance zones by using the pivotHigh and pivotLow functions. These pivots are calculated using a lookback period, which defines the number of candles to the left and right of the pivot point.
ATR-Based Threshold:
ATR (Average True Range) is used to create dynamic zones based on volatility. The ATR acts as a buffer around the identified pivot points, creating zones that are more flexible and adaptable to market conditions.
Merging Zones:
If two zones are close to each other (within a certain threshold), they are merged into a single zone. This reduces overlapping zones and gives a cleaner visual representation of significant price levels.
Confirmation Mechanism:
Each time the price touches a zone, the confirmation counter for that zone increases. The more confirmations a zone has, the more reliable it is. Zones are only displayed if they meet the required number of confirmations as specified by the user.
Color Gradient:
Zones are color-coded based on the number of confirmations. A gradient is used to visually represent the strength of each zone, with stronger zones being more vividly colored.
Heatmap Visualization:
When the heatmap is enabled, the color intensity of the zones is adjusted based on the proximity of the price to the zone and the number of touches the zone has received. This helps traders quickly identify which zones are more critical.
How to Use:
Identifying Support and Resistance Zones:
After adding the indicator to your chart, you will see horizontal lines representing key support (bullish) and resistance (bearish) levels. These zones are dynamically updated based on price action and pivots.
Adjusting Zone Sensitivity:
Use the "ATR Multiplier" to fine-tune how sensitive the indicator is to price fluctuations. A higher multiplier will reduce the number of zones, focusing on more significant levels.
Using Confirmations:
The more times a price interacts with a zone, the stronger that zone becomes. Use the "Confirmations" input to filter out weaker zones. This ensures that only zones with enough interaction (touches) are plotted.
Activating the Heatmap:
Enabling the heatmap will provide a color-coded visual representation of the strength of the zones. Zones with more price interactions will appear more vividly, helping you focus on the most significant areas.
Best Practices:
Combine with Other Indicators:
This support and resistance indicator works well when combined with other technical analysis tools, such as oscillators (e.g., RSI, MACD) or moving averages, for better trade confirmations.
Adjust Sensitivity Based on Market Conditions:
In volatile markets, you may want to increase the ATR multiplier to focus on more significant support and resistance zones. In calmer markets, decreasing the multiplier can help you spot smaller, but relevant, levels.
Use in Different Time Frames:
This indicator can be used effectively across different time frames, from intraday charts (e.g., 1-minute or 5-minute charts) to longer-term analysis on daily or weekly charts.
Look for Confluences:
Zones that overlap with other indicators, such as Fibonacci retracements or key moving averages, tend to be more reliable. Use the zones in conjunction with other forms of analysis to increase your confidence in trade setups.
Limitations and Considerations:
False Breakouts:
In highly volatile markets, there may be false breakouts where the price briefly moves through a zone without a sustained trend. Consider combining this indicator with momentum-based tools to avoid false signals.
Sensitivity to ATR Settings:
The ATR multiplier is a key component of this indicator. Adjusting it too high or too low may result in too few or too many zones, respectively. It is important to fine-tune this setting based on your specific trading style and market conditions.
Open-source script
In true TradingView spirit, the creator of this script has made it open-source, so that traders can review and verify its functionality. Kudos to the author! While you can use it for free, remember that republishing the code is subject to our House Rules.
Disclaimer
The information and publications are not meant to be, and do not constitute, financial, investment, trading, or other types of advice or recommendations supplied or endorsed by TradingView. Read more in the Terms of Use.