OPEN-SOURCE SCRIPT
Updated Elder Ray Bull and Bear Power Oscillators
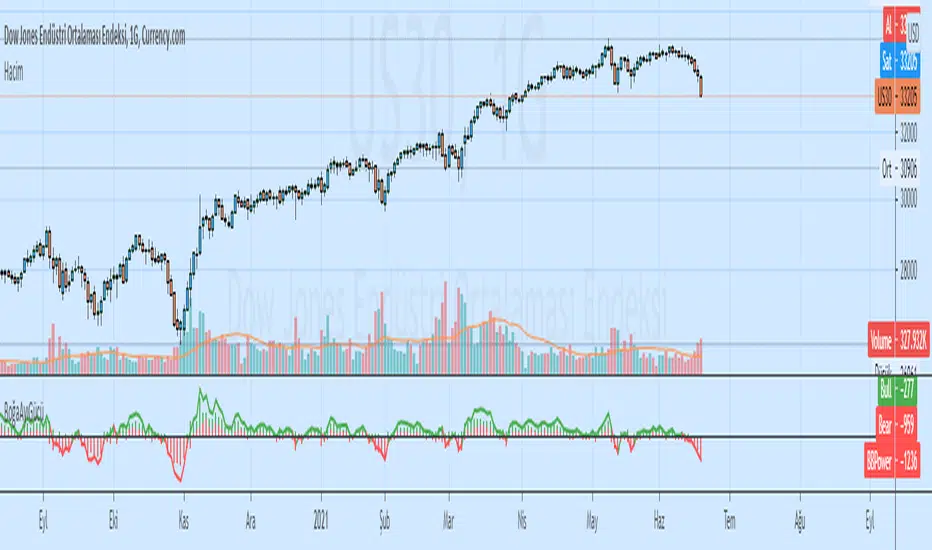
Elder Ray Bull and Bear Power Oscillators
Tradingview Screener Bull Bear Power(BBPOWER)
OVERVIEW
The Bull and Bear Power oscillators developed by Dr Alexander Elder attempt to measure the power of buyers (bulls) and sellers (bears) to push prices above and below the consensus of value. The primary principles on which Elder based the oscillator are:
The highest price displays the maximum buyer’s power within the day.
The lowest price displays the maximum seller’s power within the day.
The moving average can be construed as a price agreement between buyers and sellers for a given time period.
The Bulls/Bears power balance is important since changes in this balance can signal the early stages of a potential trend reversal.
CALCULATION
Elder uses a 13-day exponential moving average (EMA) to indicate the consensus market value.
Bull Power is calculated by subtracting the 13-day EMA from the day’s high.
Bear Power is derived by subtracting the 13-day EMA from the day’s low.
TRADING WITH THE ELDER RAY BULL AND BEAR POWER OSCILLATORS
BULL POWER
Where a currency uptrend is sustained to the point that maximum prices move above the EMA the Bull Power histogram will be greater than zero. As price maximums accelerate to greater levels (above the EMA) during the rising trend histogram bars will increase in height above the zero line showing the increased buying strength during the period.
BEAR POWER
Where a currency downtrend is sustained to the point that minimum prices move below the EMA the Bear Power histogram will be less than zero. As price minimums accelerate to lower levels (below the EMA) during the falling trend histogram bars will increase in height below the zero line showing increased selling strength during the period.
TRADING SIGNALS
It is important for traders to use the Elder Ray oscillators in conjunction with the EMA overlay over the price chart (typically as per period being analysed) to give additional context to the signals. Sell signals are given if Bull Power is above zero and there is a bearish divergence in the Bull Power histogram or if the Bull Power histogram is above zero and falling.
Buy signals are given if Bear Power is below zero and there is a bullish divergence in the Bear Power histogram or if the Bear Power histogram is below zero and rising. It is extremely important for traders to only trade in the above scenarios if the direction of the trend indicated by the slope of the EMA on the price chart is in the direction of their trade when the signal is given (or shortly after).
Release Notes
fixOpen-source script
In true TradingView spirit, the creator of this script has made it open-source, so that traders can review and verify its functionality. Kudos to the author! While you can use it for free, remember that republishing the code is subject to our House Rules.
Disclaimer
The information and publications are not meant to be, and do not constitute, financial, investment, trading, or other types of advice or recommendations supplied or endorsed by TradingView. Read more in the Terms of Use.
Open-source script
In true TradingView spirit, the creator of this script has made it open-source, so that traders can review and verify its functionality. Kudos to the author! While you can use it for free, remember that republishing the code is subject to our House Rules.
Disclaimer
The information and publications are not meant to be, and do not constitute, financial, investment, trading, or other types of advice or recommendations supplied or endorsed by TradingView. Read more in the Terms of Use.