PROTECTED SOURCE SCRIPT
KC%K

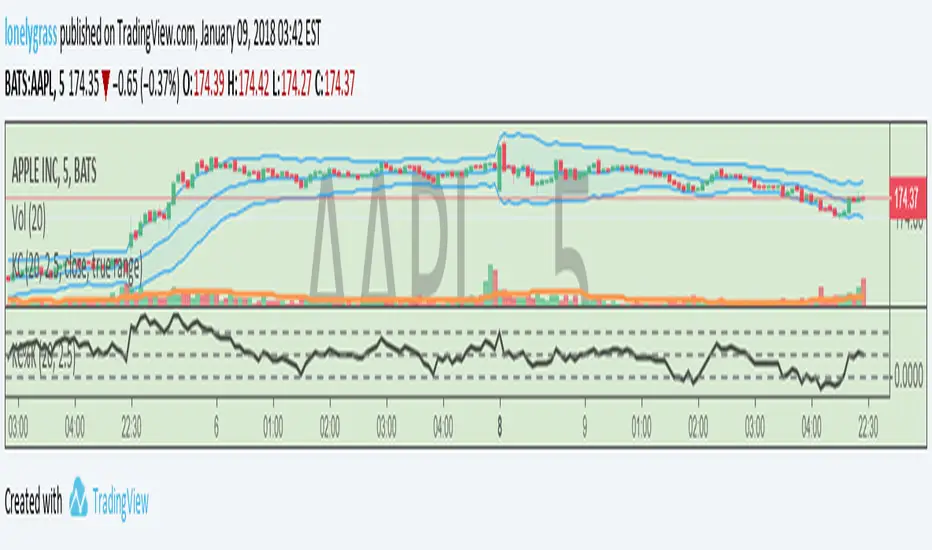
This TA is created with reference to the idea of Bollinger Bands % B, as known as "Keltner Channel % K" ,just saying.
With length of 20 and true length of 2.5, it looks to cover majority of stock price movements. For reversion to mean traders, this would suit them best because of its visual representation. 0.5 indicates mid band, 1 indicates price going outside of the upper band, and 0 means a breach of lower band.
Hope you would find it useful.
Lonelygrass
Protected script
This script is published as closed-source. However, you can use it freely and without any limitations – learn more here.
Disclaimer
The information and publications are not meant to be, and do not constitute, financial, investment, trading, or other types of advice or recommendations supplied or endorsed by TradingView. Read more in the Terms of Use.