OPEN-SOURCE SCRIPT
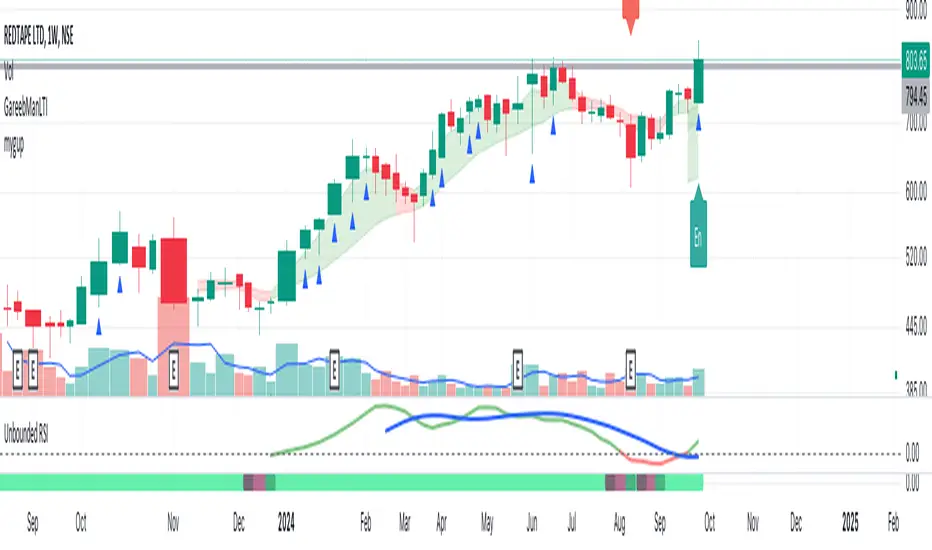
Updated Unbounded RSI

Introducing the concept of "Unbounded RSI".
Instead of indexing the average gain and average loss, over the time period of interest, we leave the average gain and loss unbounded. Instead we "bound" them by difference of each and smoothen out this difference in an envelope using exponential average. See code.
What this does to traditional RSI concept?
How to use it?
I am generally a positional long trader. So I present my version. Of course, I expect each individual who decide to use this concept, to come up with their ideas, based on their style and temperament.
The points below, I apply on a Weekly Timeframe Chart.
Note for Pine Coders:
The source code can easily be modified to develop this concept further.
For example:
Instead of indexing the average gain and average loss, over the time period of interest, we leave the average gain and loss unbounded. Instead we "bound" them by difference of each and smoothen out this difference in an envelope using exponential average. See code.
What this does to traditional RSI concept?
- No concept of "overbought", "oversold"
- No concept of "60-40", "70-30" bands and arguments over it
- No concept of "Range Shifts"
- ...
How to use it?
I am generally a positional long trader. So I present my version. Of course, I expect each individual who decide to use this concept, to come up with their ideas, based on their style and temperament.
The points below, I apply on a Weekly Timeframe Chart.
- Once, we see a long consolidation and price breakout, we should be able to see "Green" histogram bars. These appear, once we have the stock at least 20% up from the 52WL and the "Unbounded RSI" has turned positive. This can be a good time to "enter" into the scrip.
- The height of the bars are significant, since they essentially show, that the "gap" between the avg. gain and avg. loss is widening, indicating momentum. Swing trading can thrive in these environments I guess.
- Falling heights indicate that gaps to close, though, the "gap can still be green". This means, momentum is now falling. Swing traders and "quick buck makers", would ideally book profits here. If the color of the bars still remain "Green" it indicates that momentum has reduced but still the gains are "more" than loss on the timeperiod selected.
- Once the histogram turns red, it means that the gain is now lower than loss. An increasing height underground, means this loss is widening. Generally, this will corelate with price action (not necessarily volume).
- At this time, exits should be looked for, may be also check other factors/indicators to decide, but surely the momentum and the gain% over the timeperiod selected has now gone.
Note for Pine Coders:
The source code can easily be modified to develop this concept further.
For example:
- Use different smoothing algorithms
- Remove 52WL condition and introduce new additional conditions
- Instead of price change of the stock for gain/loss calculations, we use the concept of Relative Strength (RS, not RSI) and measuere the gain/loss based on a benchmark index. I intend to work on this concept, soon.
- You shall see a variable "unboundedRSI" which is actually a ratio of the Avg. Gain / Avg. Loss. This ratio is not plotted. It is kept there, for future use.
- Many more
Release Notes
Waring: This is a NBC change- A line plot instead of histogram
- A smoothening of the line plot for signals
Open-source script
In true TradingView spirit, the creator of this script has made it open-source, so that traders can review and verify its functionality. Kudos to the author! While you can use it for free, remember that republishing the code is subject to our House Rules.
Disclaimer
The information and publications are not meant to be, and do not constitute, financial, investment, trading, or other types of advice or recommendations supplied or endorsed by TradingView. Read more in the Terms of Use.