VB Resistance Support
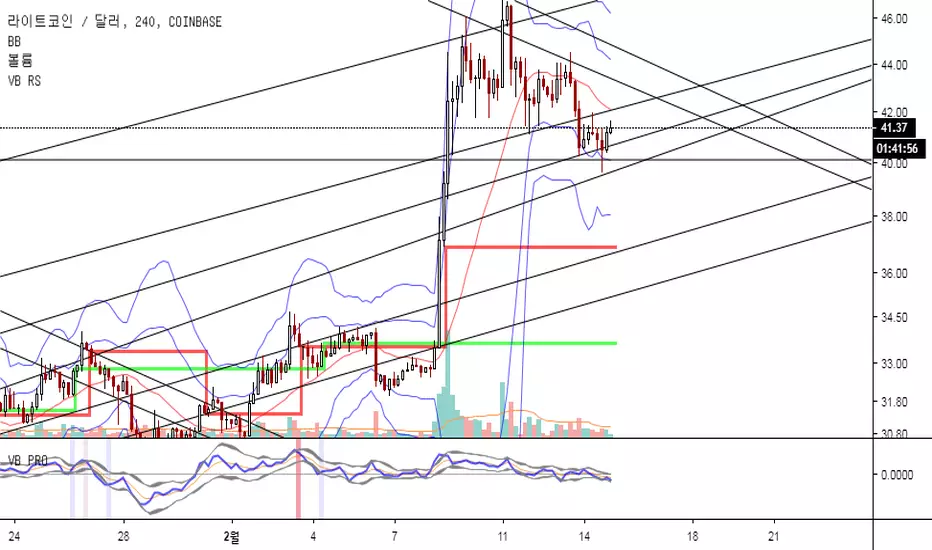
Swing highs and lows can be used by traders to identify possible areas of support and resistance , which can then be used to determine optimal positions for stop-loss or profit target orders.
highs and lows are earlier market turning points. Hence, they are natural choices for projecting support and resistance levels. Every point is a potential support or resistance level . However, for effective trading, focus on major swing highs and lows.
This indicator was created based on VB Indicator.
circles -> linebar
view background RED, GREEN, BLUE
can check cloud like Ichimoku Cloud.
Invite-only script
Only users approved by the author can access this script. You'll need to request and get permission to use it. This is typically granted after payment. For more details, follow the author's instructions below or contact sw6794 directly.
TradingView does NOT recommend paying for or using a script unless you fully trust its author and understand how it works. You may also find free, open-source alternatives in our community scripts.
Author's instructions
Disclaimer
Invite-only script
Only users approved by the author can access this script. You'll need to request and get permission to use it. This is typically granted after payment. For more details, follow the author's instructions below or contact sw6794 directly.
TradingView does NOT recommend paying for or using a script unless you fully trust its author and understand how it works. You may also find free, open-source alternatives in our community scripts.