OPEN-SOURCE SCRIPT
Updated Silver Bullet Sessions

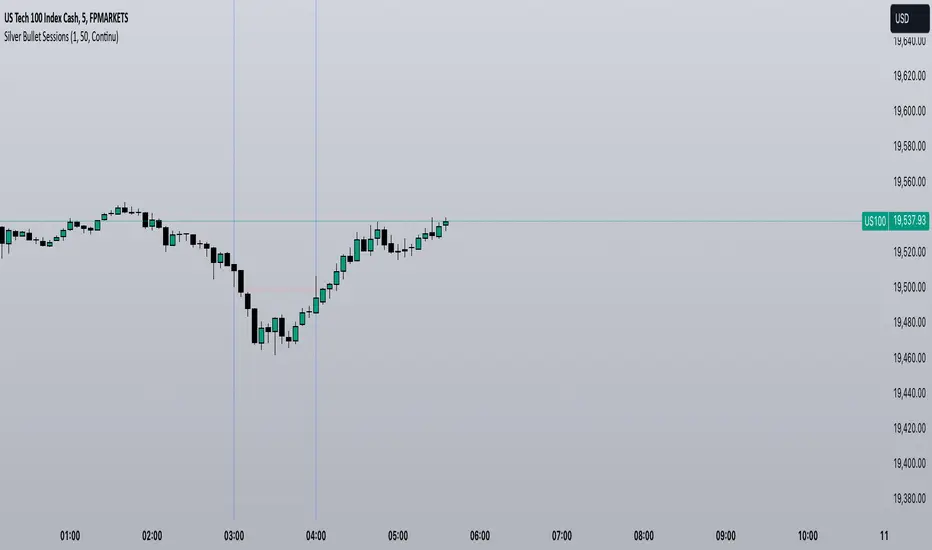
The Silver Bullet Sessions indicator is a specialized timing tool designed to highlight key market sessions throughout the trading day. By marking specific hours with vertical lines, it helps traders identify potentially significant market moments that often coincide with increased volatility and trading opportunities.
This indicator plots vertical lines at six strategic times during the trading day: 3:00 AM, 4:00 AM, 10:00 AM, 11:00 AM, 2:00 PM, and 3:00 PM. These times are carefully selected to correspond with important market events and session overlaps in the global trading cycle. The early morning hours (3-4 AM) often capture significant Asian market movements and the European market opening. The mid-morning period (10-11 AM) typically corresponds with peak European trading hours and the pre-US market dynamics. The afternoon times (2-3 PM) coincide with key US market activities and the European market close.
The indicator is implemented using Pine Script version 6, ensuring compatibility with the latest TradingView platform features. It employs a clean, efficient coding structure that minimizes resource usage while maintaining reliable performance. The vertical lines are rendered in blue for clear visibility against any chart background, and their width is optimized for easy identification without obscuring price action.
Traders can use these visual markers to:
Plan their entries and exits around these key time periods
Anticipate potential market volatility
Structure their trading sessions around these significant market hours
Identify session-based trading patterns
Release Notes
fix an issue where the 4AM line was not drawnRelease Notes
Add style configurationOpen-source script
In true TradingView spirit, the creator of this script has made it open-source, so that traders can review and verify its functionality. Kudos to the author! While you can use it for free, remember that republishing the code is subject to our House Rules.
Disclaimer
The information and publications are not meant to be, and do not constitute, financial, investment, trading, or other types of advice or recommendations supplied or endorsed by TradingView. Read more in the Terms of Use.
Open-source script
In true TradingView spirit, the creator of this script has made it open-source, so that traders can review and verify its functionality. Kudos to the author! While you can use it for free, remember that republishing the code is subject to our House Rules.
Disclaimer
The information and publications are not meant to be, and do not constitute, financial, investment, trading, or other types of advice or recommendations supplied or endorsed by TradingView. Read more in the Terms of Use.