OPEN-SOURCE SCRIPT
Updated Relative Perfomance Index
Hello Traders.
Lets keep it simple..
Good, I see you have some ideas already.
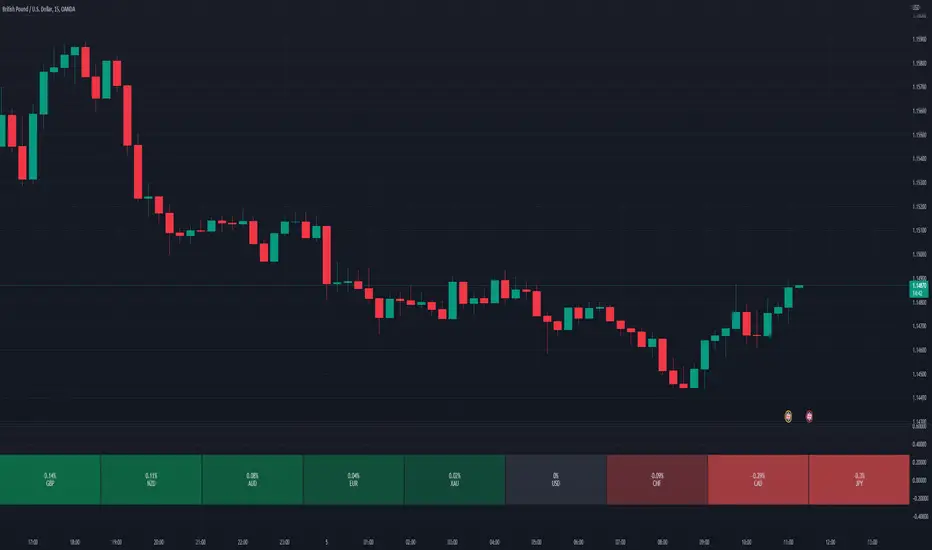
This is exactly what this indicator does. You will visualize the biggest change in pairs of the timeframe of your choice and from this you can decide on pairs that you want to trade.
Lets keep it simple..
- 1. Take the major pairs that have USD in them and watch their change over a specific timeframe.
- 2. Now lets sort these changes of each pair from the most positive to the most negative.
Good, I see you have some ideas already.
This is exactly what this indicator does. You will visualize the biggest change in pairs of the timeframe of your choice and from this you can decide on pairs that you want to trade.
Release Notes
Update tooltip to define importance of choosing your brokerRelease Notes
X2 Better UsageConfiguration
1. Use the Index setting to use something else except USD
2. Select custom pairs from the settings
Customization
Text color will use your chart foreground color
Example Usage:
1. Index Crypto by selecting the index as USDT
2. and selecting all symbols with USDT in them
Release Notes
Reduced the calculation algorithm execution time by halfUpdated to a more linear calculation. This also eliminates repeating symbols
Open-source script
In true TradingView spirit, the creator of this script has made it open-source, so that traders can review and verify its functionality. Kudos to the author! While you can use it for free, remember that republishing the code is subject to our House Rules.
🤖🤖🤖🤖🤖🤖🤖🤖🤖🤖
Automate TradingView Alerts
tradingview.to?ref=bih
🥰😍😍🥰😍😍🥰😍😍🥰
Automate TradingView Alerts
tradingview.to?ref=bih
🥰😍😍🥰😍😍🥰😍😍🥰
Disclaimer
The information and publications are not meant to be, and do not constitute, financial, investment, trading, or other types of advice or recommendations supplied or endorsed by TradingView. Read more in the Terms of Use.