OPEN-SOURCE SCRIPT
Moving Fib Based on Donchain/Pivot/BB
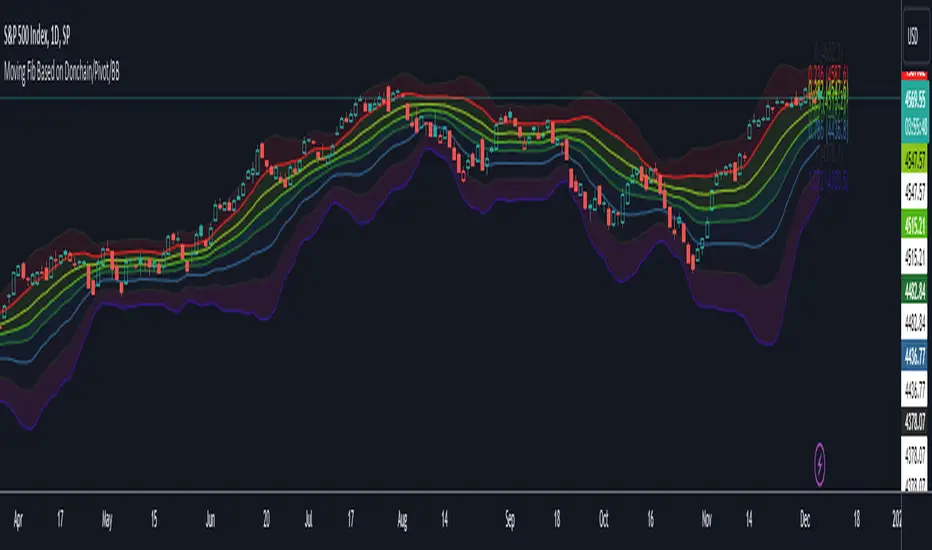
This script's purpose is to provide the user with an indicator that automatically plots Fibonacci levels. The user has three main options for determining the Fibonacci's high and low. This indicator offers an ample number of settings, making it a modular Fibonacci overlay.

The default setting is based on Donchian high and low.

Another option is to base the high and low on TradingView's Pivot indicator.

The last option is to determine Fibonacci levels based on Bollinger Bands.

Add up to 16 Fib levels with customizable settings, plot them on a log scale, and explore various other settings to personalize the Fib overlay.
This indicator can be utilized for trading momentum or mean reversion strategies
The default setting is based on Donchian high and low.
Another option is to base the high and low on TradingView's Pivot indicator.
The last option is to determine Fibonacci levels based on Bollinger Bands.
Add up to 16 Fib levels with customizable settings, plot them on a log scale, and explore various other settings to personalize the Fib overlay.
This indicator can be utilized for trading momentum or mean reversion strategies
Open-source script
In true TradingView spirit, the creator of this script has made it open-source, so that traders can review and verify its functionality. Kudos to the author! While you can use it for free, remember that republishing the code is subject to our House Rules.
Disclaimer
The information and publications are not meant to be, and do not constitute, financial, investment, trading, or other types of advice or recommendations supplied or endorsed by TradingView. Read more in the Terms of Use.