OPEN-SOURCE SCRIPT
Updated Previous Day High, Low + Today's Opening Price [DB]
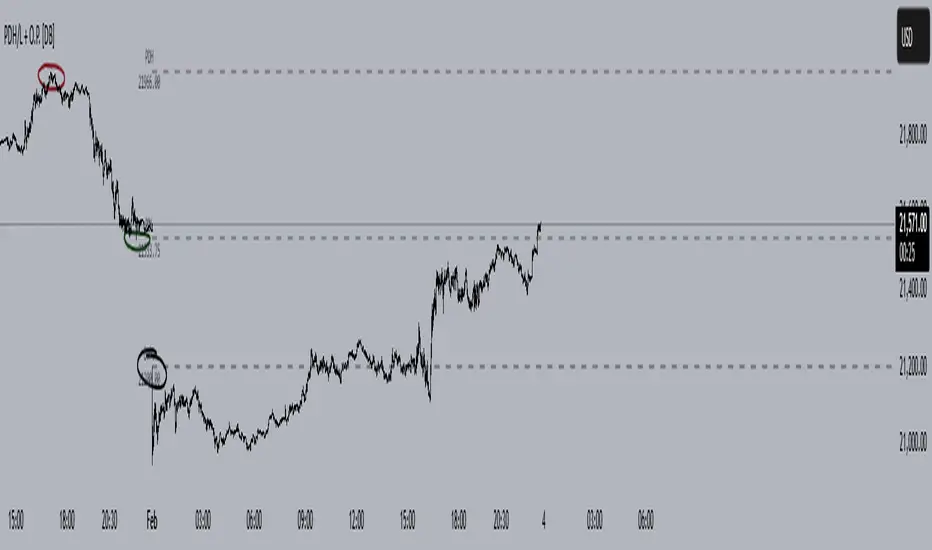
This indicator plots horizontal reference lines showing three price levels:
Settings & Customization
Labels:
The goal of this indicator is to simplify tracking potentionally important daily levels without manual drawing.
Works on all timeframes (from 1-minute to weekly charts). The levels auto-update daily at market open and they are non-repainting (historical levels stay fixed).
- Previous Day's High (PDH) – Dark red line by default
- Previous Day's Low (PDL) – Dark green line by default
- Today's Opening Price (O.P.) – Black line by default
Settings & Customization
- Adjust line colors, width (default: 2px), and transparency (30% by default).
- Choose line styles: Solid, Dashed, or Dotted.
Labels:
- Toggle labels (PDH/PDL/O.P.) on/off.
- Optional price values below labels.
The goal of this indicator is to simplify tracking potentionally important daily levels without manual drawing.
Works on all timeframes (from 1-minute to weekly charts). The levels auto-update daily at market open and they are non-repainting (historical levels stay fixed).
Release Notes
Fixed a bug where adding the indicator to the chart created a new price scale.Open-source script
In true TradingView spirit, the creator of this script has made it open-source, so that traders can review and verify its functionality. Kudos to the author! While you can use it for free, remember that republishing the code is subject to our House Rules.
Disclaimer
The information and publications are not meant to be, and do not constitute, financial, investment, trading, or other types of advice or recommendations supplied or endorsed by TradingView. Read more in the Terms of Use.
Open-source script
In true TradingView spirit, the creator of this script has made it open-source, so that traders can review and verify its functionality. Kudos to the author! While you can use it for free, remember that republishing the code is subject to our House Rules.
Disclaimer
The information and publications are not meant to be, and do not constitute, financial, investment, trading, or other types of advice or recommendations supplied or endorsed by TradingView. Read more in the Terms of Use.