LFOM Index
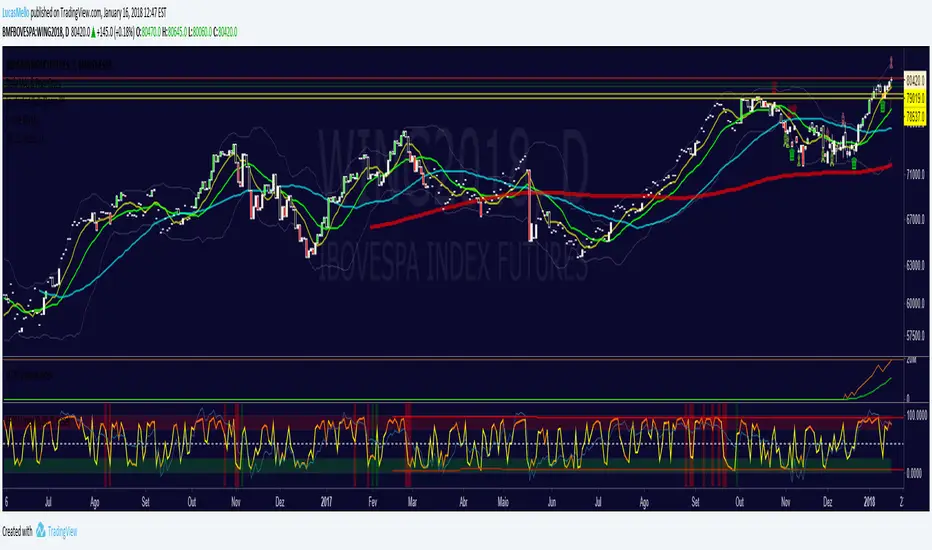
The ticker line act as a common momentum oscillator. When it's orange, the trustability of the overbought/oversold condition is greater.
The thiner line is made to be used on range moments, such as squares or envelopes.
The background collors indicates good moments to buy (green) or sell (red) - the signal is triggered in the very moment that the background color appears.
How to use:
!!!!! DON'T SELL ON STRONG BULL TRENDS AND DON'T BUY ON STRONG BEAR TRENDS!!
When facing a extremely strong bull market, overbought areas must be used as signs to take profits, not points to enter conter positions. The same rule applies to strong bear markets, in which the oversold areas indicates good points to cover position.
Invite-only script
Only users approved by the author can access this script. You'll need to request and get permission to use it. This is typically granted after payment. For more details, follow the author's instructions below or contact LucasMello directly.
TradingView does NOT recommend paying for or using a script unless you fully trust its author and understand how it works. You may also find free, open-source alternatives in our community scripts.
Author's instructions
Disclaimer
Invite-only script
Only users approved by the author can access this script. You'll need to request and get permission to use it. This is typically granted after payment. For more details, follow the author's instructions below or contact LucasMello directly.
TradingView does NOT recommend paying for or using a script unless you fully trust its author and understand how it works. You may also find free, open-source alternatives in our community scripts.