PROTECTED SOURCE SCRIPT
Custom RSI [Mr_Orange]
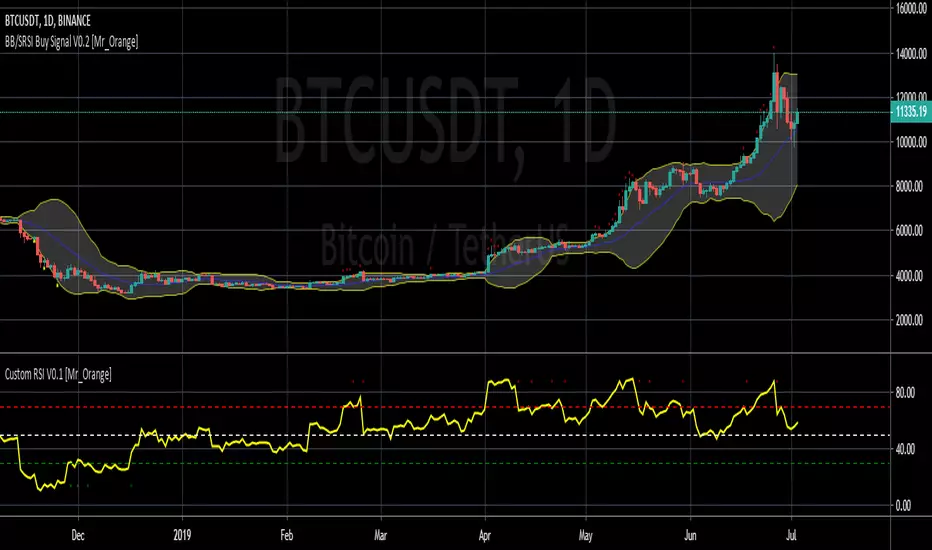
This is my custom RSI script, which is basically a normal RSI chart. Except it has build in alerts, based on the RSI strategy indicator, and I like the colors better.
* Buy signal is based on RSI crossunder from overbought to neutral zone
* Sell signal is based on RSI crossover from oversold to neutral zone
Both oversold and overbought can be adjusted. Future functionality will also include RSI rise and fall %
Thanks for checking it out! If you think it is worth something:
- BTC: 1NrG3Sy2VW8u4wWHucj1CQjKQ6hXYwbSyX
Protected script
This script is published as closed-source. However, you can use it freely and without any limitations – learn more here.
Disclaimer
The information and publications are not meant to be, and do not constitute, financial, investment, trading, or other types of advice or recommendations supplied or endorsed by TradingView. Read more in the Terms of Use.