PROTECTED SOURCE SCRIPT
Updated Black Tie Fibonacci
This indicator plots Yesterday’s, Last Week’s, or Last Month’s Open/Close/High/Low levels, plus Fibonacci retracements and the Optimal Trade Entry (OTE) zone. It includes alerts for each key level, making it perfect for trading reactions on lower timeframes (15m-5m).
The goal of all my indicators is to save you time on manual charting—because making money shouldn’t mean being glued to a screen.
Hope you enjoy it,
The goal of all my indicators is to save you time on manual charting—because making money shouldn’t mean being glued to a screen.
Hope you enjoy it,
Release Notes
This update adds dynamic bias determination based on a selectable timeframe (`bias_tf`), comparing current price levels (high, low, open, close) to the previous day's range. It also introduces a customizable table to display the current bias (bullish, bearish, or neutral) directly on the chart.Release Notes
Added some clarifications for the bias for more precision:- Bullish (Breakout Above Yesterday's High)
- Bearish (Rejection at High)
- Bearish (Breakout Below Yesterday's Low)
- Bullish (Bounce at Low)
- Neutral (Within Yesterday's High and Low)
Release Notes
The Bias determination now also considers the Close, which gives you better insights than just considering the price action "Neutral" when it's still within Yesterday's High/Low.Release Notes
Improved bias detection.Release Notes
Black Tie Fibonacci now includes also Bias Change Alerts. Right-click on the indicator, select "Add Alert" and then "Bias Change".Release Notes
Improved Bias Logic.Release Notes
All scenarios/biases have been updated. The indicator now classifies price action into 18 distinct scenarios:1) Strong Bullish Breakout
Bullish candle body crossing above Yesterday's High, indicating strong upward momentum.
2) Strong Bearish Breakout
Bearish candle body crossing below Yesterday's Low, indicating strong downward momentum.
3) Bullish with Resistance at Yesterday's Close (Weaker Bullish Potential)
Bullish candle with wick below Yesterday's Low and Close below Yesterday's Close.
4) Bullish with Support at Yesterday's Close (Moderate Bullish Potential)
Bullish candle with wick below Yesterday's Close and Close above Yesterday's Close, without touching Yesterday's High.
5) Bearish with Support at Yesterday's Close (Weaker Bearish Potential)
Bearish candle with wick above Yesterday's High and Close above Yesterday's Close.
6) Bearish Rejection (Stronger Bearish Potential)
Bearish candle with wick above Yesterday's High and Close below Yesterday's Close.
7) Bearish Rejection (Weaker Bullish Potential)
Bearish candle with wick below Yesterday's Low and Close below Yesterday's Close.
8) Bearish Rejection (Stronger Bullish Potential)
Bearish candle with wick below Yesterday's Low and Close above Yesterday's Close.
9) Bullish Rejection (Weaker Bearish Potential)
Bullish candle with wick above Yesterday's High and Close above Yesterday's Close.
10) Bullish Rejection (Stronger Bearish Potential)
Bullish candle with wick above Yesterday's High and Close below Yesterday's Close.
11) Neutral Bullish (Weaker Bullish Potential)
Bullish candle with wick above Yesterday's High and Close above Yesterday's Close, within Yesterday's Low and Yesterday's Close.
12) Neutral Bullish (Stronger Bullish Potential)
Bullish candle within Yesterday's Close and Yesterday's High, not touching any of the lines.
13) Neutral Bearish (Stronger Bearish Potential)
Bearish candle within Yesterday's Low and Yesterday's Close, not touching any of the lines.
14) Neutral Bearish (Weaker Bearish Potential)
Bearish candle within Yesterday's Close and Yesterday's High, not touching any of the lines.
15) Bullish Break (Moderate Bullish Potential)
Bullish candle crossing Yesterday's Close, but not touching Yesterday's Low or High.
16) Bearish Break (Moderate Bearish Potential)
Bearish candle crossing Yesterday's Close, but not touching Yesterday's High or Low.
17) Bullish with Support at Yesterday's Close (Moderate Bullish Potential)
Bullish candle body between Yesterday's High and Yesterday's Close, with wick below Yesterday's Close but without touching Yesterday's Low.
18) Bearish with Resistance at Yesterday's Close (Moderate Bearish Potential)
Bearish candle body between Yesterday's Low and Yesterday's Close, with wick above Yesterday's Close but without touching Yesterday's High.
I hope you like it!
Release Notes
Just minor updates of the code.Release Notes
Minor update to make the bias consistent when you switch timeframes.Release Notes
Code details.Release Notes
Just added some code details.Release Notes
The indicator now displays the start-of-day markers for the last three days.Release Notes
This indicator now compares the current candle’s open, high, low, and close on your chosen timeframe (such as daily or 4H) with the previous candle’s key levels and then assigns one of 17 distinct scenarios. It works on any timeframe you choose—for example, if you select a 4H bias instead of a daily bias, the indicator will always plot the key levels and the corresponding bias from that timeframe.
Each scenario is labeled to show both the candle’s structure and the important support and resistance levels, which helps you understand the market’s bias.
Here’s an explanation of how the scenarios are defined and what they mean using the daily bias as an example:
A) Breakouts
- Bullish Breakout: When the body of a bullish candle crosses above yesterday’s high, it is considered a bullish breakout. The previous high now becomes support as the price has moved decisively higher.
- Bearish Breakout: When the body of a bearish candle crosses below yesterday’s low, it signals a bearish breakout. The previous low becomes resistance as the price has dropped decisively.
B) Trap Bar
- Bullish Trap Bar: A bullish candle that dips below yesterday’s low and closes below yesterday’s close. This pattern can trap short sellers and may signal an upcoming reversal.
C) Failed Attempts
- Failed Breakdown: A bullish candle that temporarily tests below yesterday’s close but then recovers to close above it, indicating that the breakdown attempt was rejected.
- Failed Bullish Rally: A bearish candle during an attempted rally—its high goes above yesterday’s high, yet it still closes above yesterday’s close—suggesting that the rally has failed.
- Failed Bullish Breakout: A bearish candle that tests above yesterday’s high but closes below yesterday’s close, showing that the attempted bullish breakout did not hold.
D) Rejections (with an expected reversal bias)
- Bearish Rejection (Variant 1): A bearish candle whose low goes below yesterday’s low and closes below yesterday’s close, reinforcing the bearish move.
- Bearish Rejection (Variant 2): A bearish candle whose low goes below yesterday’s low but closes above yesterday’s close. Although the candle appears bearish, the overall expectation is for a reversal to the upside (hence the “Bullish:” prefix in this context).
E) High Tests and False Breakouts
- Previous High Test: A bullish candle that closes above yesterday’s close and also pushes above yesterday’s high, suggesting that yesterday’s high might now act as support.
- False Bullish Breakout: A bullish candle whose upper wick exceeds yesterday’s high but ultimately closes below yesterday’s close, meaning the attempted breakout was not sustained.
F) Inside Candles
- Bullish Inside Candle: A bullish candle that stays completely between yesterday’s close (acting as support) and yesterday’s high (acting as resistance), indicating consolidation.
- Bearish Inside Candle (Variant 1): A bearish candle confined between yesterday’s low and yesterday’s close.
- Bearish Inside Candle (Variant 2): A bearish candle confined between yesterday’s close and yesterday’s high.
G) Close Breaks (with or without a wick)
- Close Break: A candle that breaks the previous close while the rest of its body stays within yesterday’s range. For bullish candles, the close is above yesterday’s close; for bearish candles, it is below.
- Close Break with Wick: For bullish candles, this means the candle closes above yesterday’s close but has a lower wick (indicating a brief pullback). For bearish candles, a similar concept applies with an upper wick rejection. In both cases, the support and resistance levels remain defined by the previous day’s low and high.
Overall, these 17 scenarios provide a detailed framework for analyzing how the current candle interacts with the previous day’s key levels.
By clearly defining which levels serve as support or resistance and categorizing the candle’s behavior accordingly, this indicator removes ambiguity from candlestick patterns and offers a clear, rule-based method for gauging market bias.
Release Notes
The Black Tie Report Fibonacci Now includes Session Lines with Alerts!Enjoy it.
Release Notes
Original clean version of the Black Tie Report Fibonacci.Release Notes
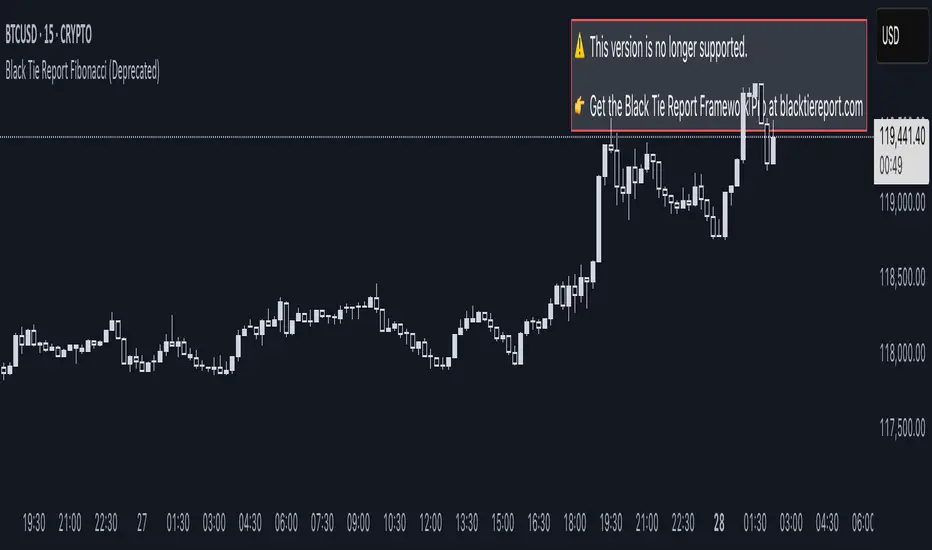
⚠️ The Black Tie Report Fibonacci has been officially **deprecated** and is no longer maintained.• All original features have been removed to prevent abuse.
• A single notification panel now points to the Black Tie Report Framework Pro version.
• To access full entry logic, automatic bias shifts, impulse markers, liquidity tools, session boxes, alerts and more, please visit:
👉 blacktiereport.com
Thank you for your understanding. The Pro version will always be kept up-to-date with the latest enhancements.
Protected script
This script is published as closed-source. However, you can use it freely and without any limitations – learn more here.
In-depth analysis and tools to profit from any trend. Educational use only — not financial advice. Subscribe to the Free Newsletter at blacktiereport.com
Disclaimer
The information and publications are not meant to be, and do not constitute, financial, investment, trading, or other types of advice or recommendations supplied or endorsed by TradingView. Read more in the Terms of Use.