OPEN-SOURCE SCRIPT
Updated Monthly Weekly Daily Hourly CLOSES
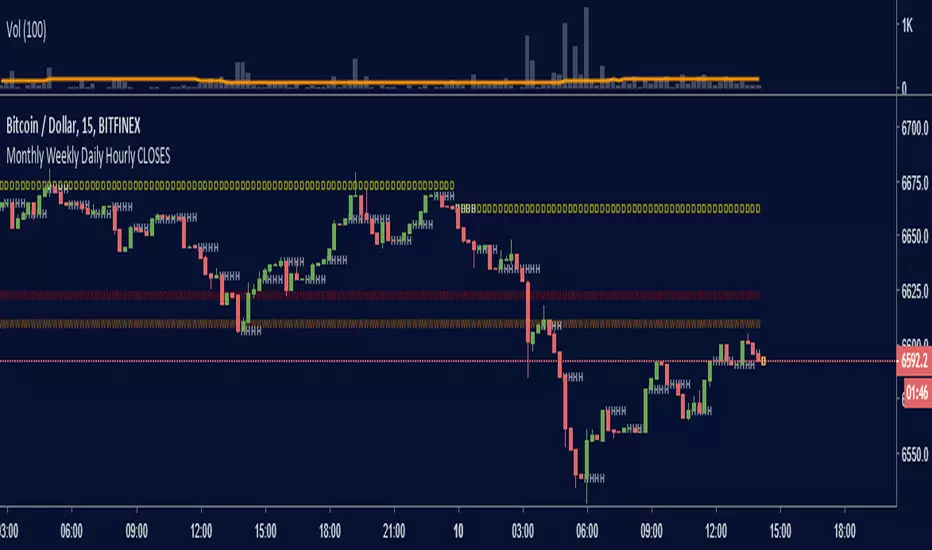
Draws horizontal segments where the last Monthly, Weekly, Daily and Hourly closes are.
Easily identify current price relative position to these key prices.
I use it as a kind of pivot points and help me with trend following entries: longs if up from last close, shorts if down from last close.
Monthly: red line (MMMMM)
Weekly: orange line (WWWWW)
Daily: yellow line (DDDDD)
Hourly: white line (HHHHH)
//Original idea from "Key Levels [treypeng]
Release Notes
Added high / low for each periodAdjusted colors and character for visibility
Open-source script
In true TradingView spirit, the creator of this script has made it open-source, so that traders can review and verify its functionality. Kudos to the author! While you can use it for free, remember that republishing the code is subject to our House Rules.
Disclaimer
The information and publications are not meant to be, and do not constitute, financial, investment, trading, or other types of advice or recommendations supplied or endorsed by TradingView. Read more in the Terms of Use.